AI-assisted claim charting can save a huge amount of time. It can help you compare a patent claim to a product, a paper, a system, or a piece of code much faster than doing it by hand. But speed is not the same as strength.
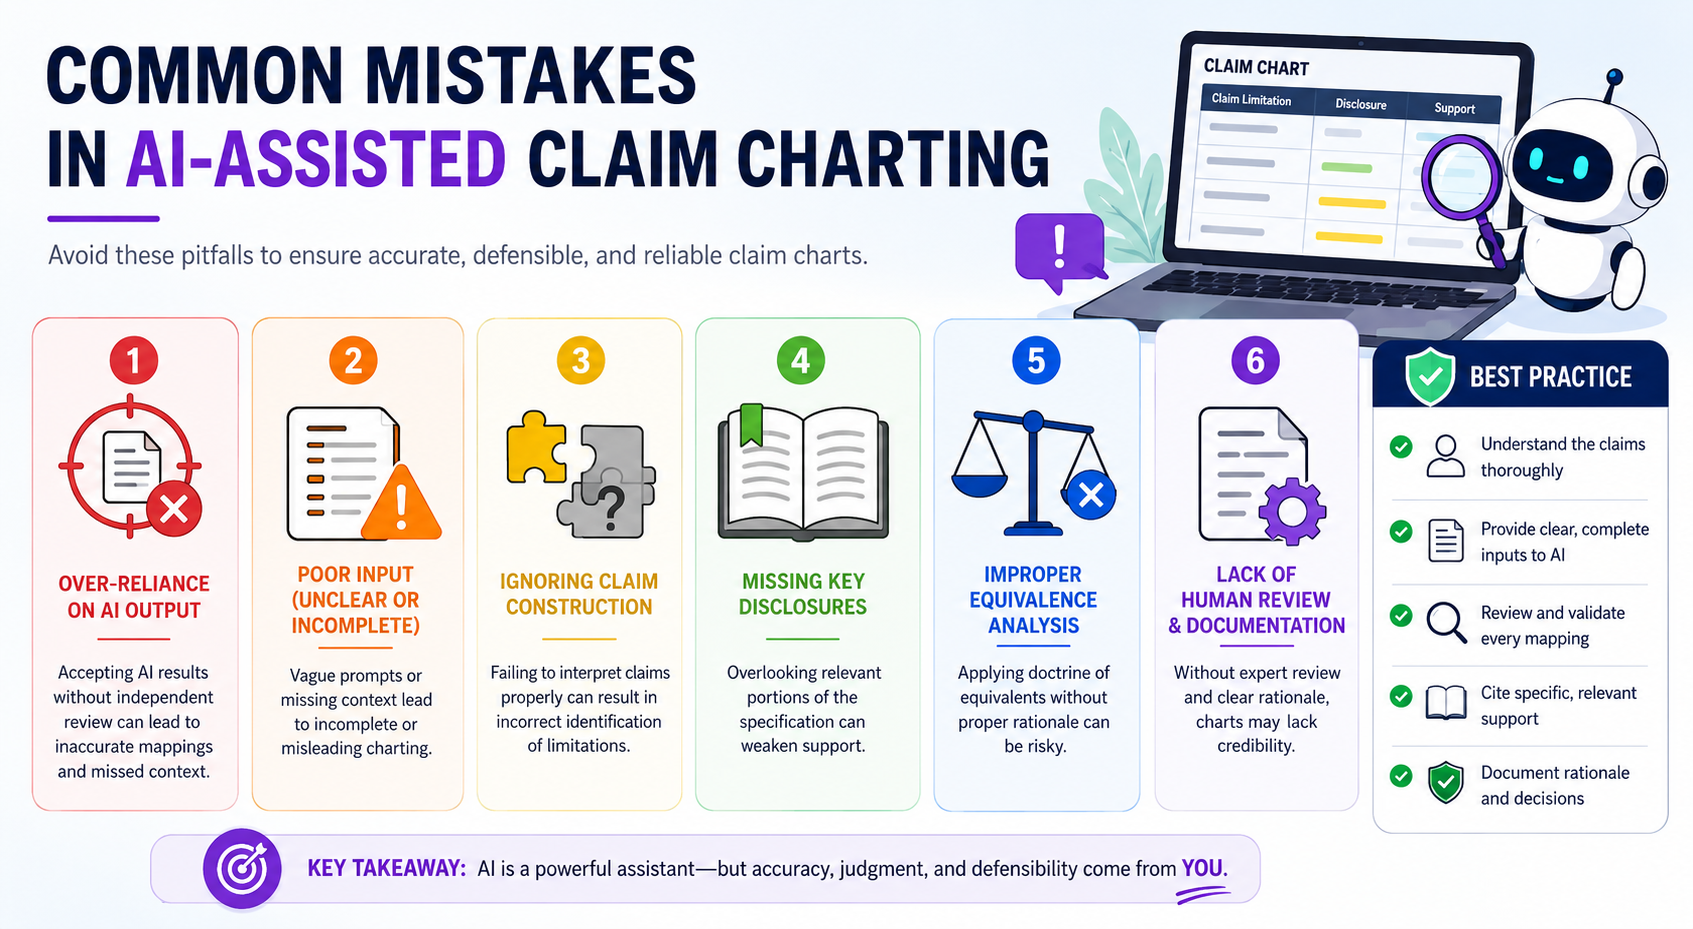
Treating AI as the decision maker instead of the helper
AI is useful in claim charting because it can move through a lot of text fast. It can read a patent claim, scan a product page, compare features, and draft a first pass.
That is a big win when your team is busy building, selling, hiring, and shipping.
But AI should not be the final judge.
This is one of the most common mistakes in AI-assisted claim charting. A founder, engineer, or even a busy patent team may look at a clean AI-made chart and assume the work is done.
The table looks neat. The claim parts are lined up. The language sounds confident. The matches seem to make sense. So the team moves forward.
That is where the risk begins.
AI can help you move faster, but it does not truly know your invention the way your team does. It does not know the hard tradeoffs behind your product.
It does not know why one design choice matters more than another. It does not always know when a feature is just similar on the surface, but different in how it works.
A claim chart is not just a matching game. It is a careful map. It tries to show how each part of a patent claim connects to real proof. If the map is wrong, the whole story can fall apart.
AI can sound certain even when it is wrong
One hard thing about AI is that it can write with confidence even when the match is weak. It may say a product includes a claimed feature because a few words look close.
It may pull a line from a website and treat it as proof, even though the line does not really show the feature. It may skip over a small word in the claim that changes the whole meaning.
That small word can matter a lot.
For example, a claim may require that a model updates in real time based on user input. AI may find a product page that says the system uses “live data” or “smart updates.” Those words sound close.
But they may not prove that the model updates in the exact way the claim requires. The product may only refresh a dashboard. It may not retrain or adjust the model. It may not use the kind of input the claim describes.
A human reviewer has to ask the next question. What does this phrase really prove? Is this enough? Are we filling in gaps? Are we guessing?
That kind of judgment matters. AI can help find the clue. Your team still needs to decide whether the clue is strong enough.
The better way is to keep AI in the first-pass role
The best use of AI is to let it do the heavy lift early, then bring in human review before you trust the result.
AI can draft the first version, flag likely matches, organize source links, and point out areas that need more proof. That can save hours.
But the next step should be review by people who understand the technology and the patent goal.
For a startup, this usually means the inventor, a technical lead, and a patent professional should each play a role. The inventor can explain what the system really does.
The technical lead can confirm what is actually built or planned. The patent professional can check whether the chart supports a strong patent strategy.
This is where PowerPatent can help. PowerPatent gives founders smart tools to move faster, while real patent attorneys help keep the work sharp, clear, and grounded.
That mix matters because patents are not just documents. They are business tools. You can see how the process works at https://powerpatent.com/how-it-works.
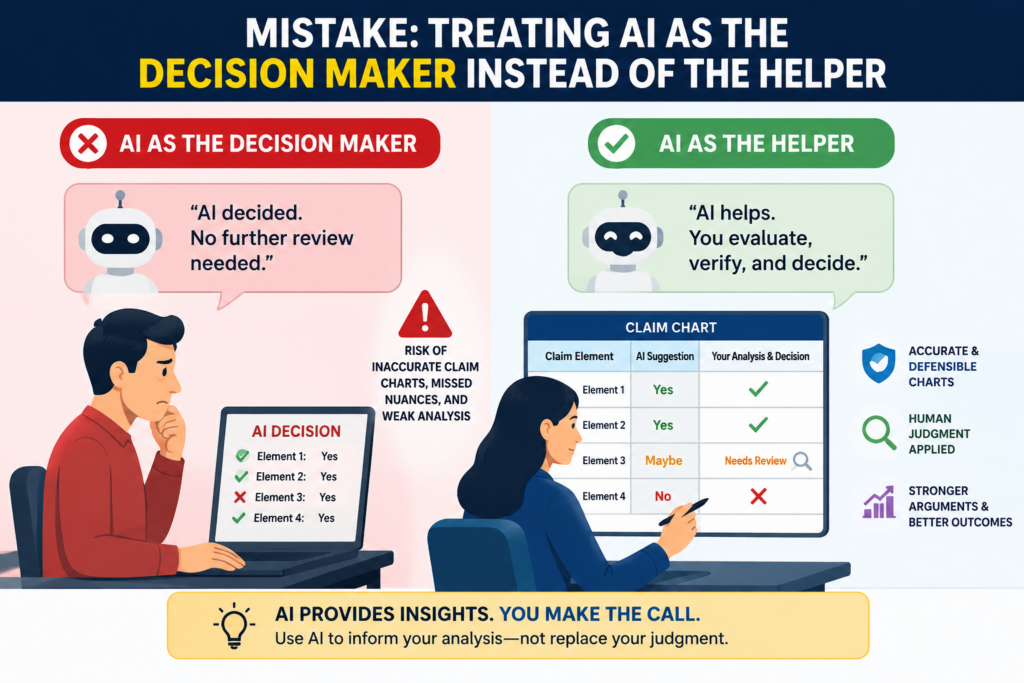
Matching words instead of matching meaning
AI is very good at spotting similar words. That can be useful, but it can also be dangerous.
In claim charting, similar words do not always mean similar systems. Two products can use the same terms and still work in very different ways.
Two papers can describe “training,” “ranking,” “prediction,” or “classification,” but the real method may not match the claim at all.
This mistake is especially common in AI, software, robotics, chips, data systems, and deep tech. These fields use many shared words. A lot of companies say they use models, pipelines, embeddings, agents, sensors, clusters, or inference.
Those words may look like a match. But the claim may require a very specific order of steps, data flow, hardware link, model behavior, or control loop.
When the chart only matches words, it can look strong while hiding a weak core.
A claim chart must follow what the claim actually says
A patent claim is built from parts. Each part has a job. Some parts describe an input. Some describe a process. Some describe an output.
Some describe how one step depends on another. If the chart does not track those parts with care, it can blur the real issue.
AI may match a whole paragraph from a product page to several claim parts at once. That may feel efficient, but it can also hide missing proof.
A good chart should show why each part is met. It should not just dump broad text into a table and hope the reader connects the dots.
For example, say a claim includes a step of receiving sensor data, cleaning that data, feeding it into a trained model, generating a control signal, and using that signal to adjust a machine.
A weak AI chart may find one source that says the product “uses AI and sensors to improve machine performance.” That sentence sounds close, but it does not prove each step.
It does not show cleaning. It does not show the trained model. It does not show a control signal. It does not show the machine adjustment.
The chart needs more than a vibe. It needs a clear link.
The better way is to explain the match in plain words
A strong AI-assisted chart should not only quote or cite a source. It should also explain the match in simple words.
The explanation should answer a plain question: why does this proof show this claim part?
If the answer is clear, the chart gets stronger. If the answer feels forced, the team should slow down. That forced feeling is often a sign that the chart is stretching.
This is also why founders should not leave claim charting only to generic tools. Your patent work should connect to your real product, your market, and your moat. A basic AI tool may help you find text. It may not help you build a smart protection plan.
PowerPatent is built for teams that want speed, but also want the work checked in a real way by people who understand patents and technical products. The walkthrough is here: https://powerpatent.com/how-it-works.
Ignoring the small claim words that carry the most weight
Some of the most important parts of a patent claim are the smallest words.
Words like each, based on, in response to, before, after, between, automatically, continuously, selected from, and configured to can change the meaning of a claim.
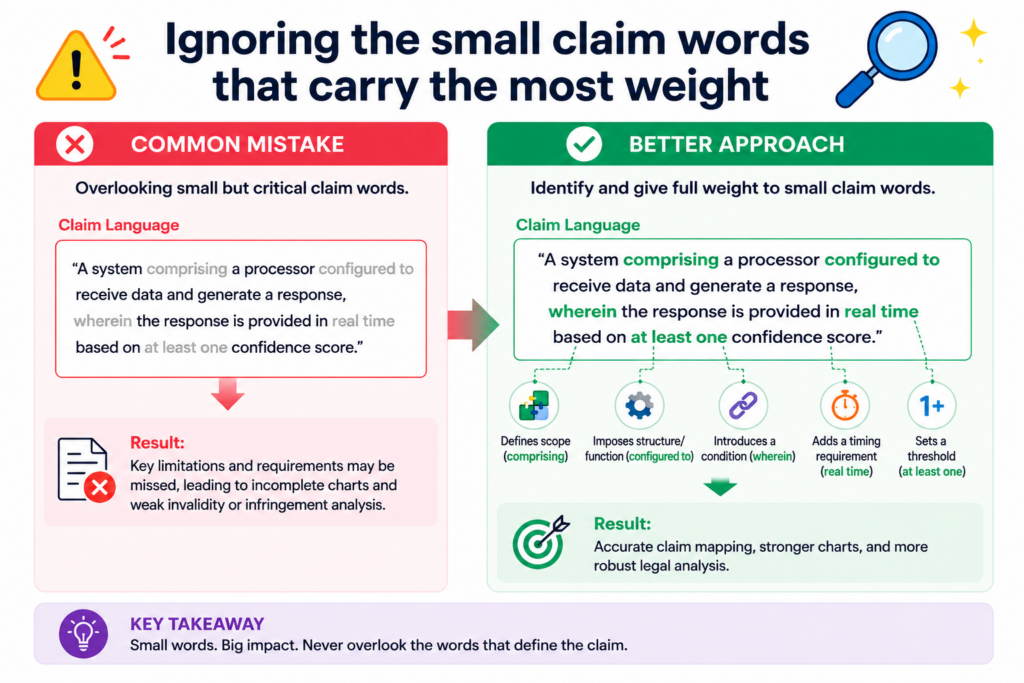
AI can miss that. Humans can miss it too, especially when they are moving fast.
This is a major issue in AI-assisted claim charting because AI often focuses on bigger terms.
It may pay attention to “machine learning model” or “user device” or “training data,” but glide past the little words that define how those pieces must work together.
That can lead to a chart that looks complete but is missing the real test.
The order of steps can change the whole match
In many software and AI claims, the order of steps matters. A claim may require that one action happens before another.
It may require that a system responds to a certain event. It may require that a result is generated based on a specific input.
If AI finds all the right words but does not prove the right order, the match may be weak.
Imagine a claim that says a system receives a user request, selects a model based on the request, generates an answer using the selected model, and then updates a user profile based on the answer.
A product page may say the system uses models, answers user requests, and updates profiles. That is not always enough. The key question is whether the product does those things in the claimed order and for the claimed reason.
A good chart should not assume order. It should show it.
That can require product docs, technical blogs, API pages, code comments, demo videos, white papers, or inventor knowledge. AI can help search for those sources. It should not invent the missing link.
The better way is to slow down on every limiting word
A practical way to improve AI-assisted claim charting is to make the AI break the claim into smaller parts before charting. Then a human should check each part.
Do not let the chart treat a long claim sentence as one block. Split it into the real pieces. Ask what each piece requires. Then ask what proof shows that exact thing.
This simple habit can prevent a lot of bad charts. It forces the team to see what is proven, what is assumed, and what is still unknown.
It also helps founders make better patent choices. Maybe the current claim is too narrow. Maybe a better filing should cover a broader version of the idea.
Maybe the proof shows a stronger feature than the team first noticed. Claim charting is not just about checking boxes. Done right, it helps you understand where the real value lives.
That is one reason PowerPatent focuses on helping founders turn technical work into stronger patent assets without slowing down the business.
The software helps organize the work, and attorney oversight helps catch the things that matter before they become expensive problems. Learn more at https://powerpatent.com/how-it-works.
Using weak sources as if they prove strong facts
A claim chart is only as strong as the proof behind it. This is where many AI-assisted charts break down. The AI may find a clean sentence on a product page, then place it next to a claim part as if that sentence proves everything.
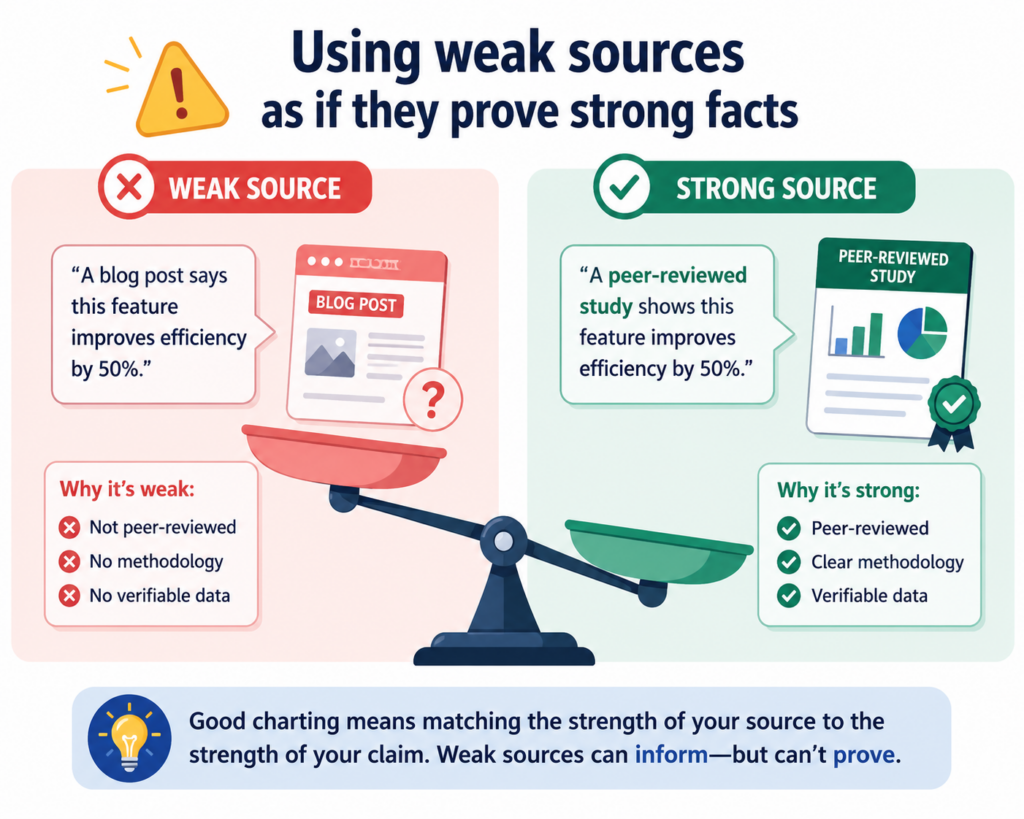
But marketing pages are often broad. They are made to sell. They may not explain how the system truly works.
This does not mean product pages are useless. They can be a good starting point. But they are rarely enough on their own, especially for AI systems, software tools, hardware devices, or deep tech products where the real value lives under the surface.
A strong chart needs proof that is clear, direct, and tied to the claim language. If the source only says the product is “smart,” “automated,” “AI-powered,” or “real time,” that may not prove the claim part. It may only show a general idea.
AI often grabs the easiest proof, not the best proof
AI tools tend to pick the text that is easiest to find. That can mean public pages, short blurbs, press releases, support pages, and product summaries. These can help, but they may leave big gaps.
For example, a claim may require a system that ranks candidate outputs using a confidence score from a model. The AI may find a source that says the product “uses AI to improve output quality.”
That is not the same thing. It does not show ranking. It does not show candidate outputs. It does not show a confidence score. It does not show that the score comes from the model.
A human reviewer should push for better proof. That might include technical docs, API references, demo videos, architecture diagrams, patents, academic papers, source code, GitHub notes, release notes, customer guides, or inventor interviews.
The goal is not to make the chart longer. The goal is to make it more real.
Strong proof makes the chart easier to trust
A good claim chart should make the reader feel that the connection is not being forced. The proof should do the work. The explanation should be clear. The chart should not depend on hope, guesswork, or broad claims.
This is where founders can gain a real edge. Many teams rush through patent work because they think it is only paperwork.
But the quality of the proof can shape the quality of the patent strategy. It can help show what is worth protecting, what is still unclear, and where the moat may be strongest.
PowerPatent helps teams bring this kind of structure into the process without turning it into a slow, painful project.
The software helps gather and organize the technical story, while real attorney oversight helps make sure the work is not built on soft proof. See how it works here: https://powerpatent.com/how-it-works.
Letting AI fill gaps with assumptions
AI is good at making text feel complete. That can be helpful when drafting. It can also be risky when charting.
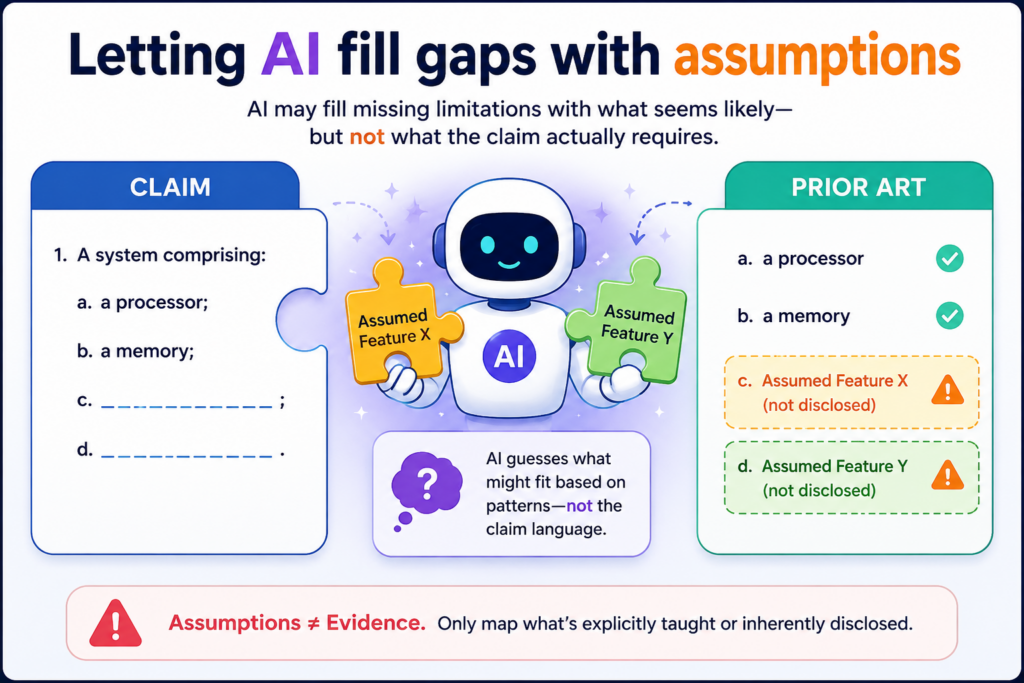
A claim chart should show what is supported. It should not quietly fill missing parts with assumptions.
Yet this happens often with AI-assisted work. The tool sees a few matching signs, then writes the rest as if it must be true.
That is dangerous because many technical systems look alike from the outside. Two tools may both use AI.
Two platforms may both process data. Two devices may both send signals. But the inner steps can be very different.
When AI fills gaps, the chart may become less of a proof map and more of a guess.
The chart should say what is known and what is not known
A strong chart does not pretend every answer is clear. It separates solid proof from open questions. That is not a weakness. It is a strength.
If a claim part is not proven yet, the chart should say so. It can explain what proof is needed. It can point to likely places to check. It can mark the issue for attorney review. This helps the team avoid false confidence.
For example, suppose a claim requires a system to train a model using feedback from a remote device.
The available source may show that the product collects feedback. It may also show that the product uses a trained model.
But it may not show that the feedback is used to train that model. A weak AI chart may connect those facts and treat the claim part as met. A stronger chart would pause and say the link is not yet proven.
That pause can save money later.
Honest gaps lead to better patent decisions
Founders often feel pressure to make everything look buttoned up. That is understandable. But in patent work, honest gaps are useful. They show where the team needs more data.
They show where a claim may need to be adjusted. They show where a new filing may need better support.
This is especially important when a startup is trying to protect a fast-moving product. The product may be changing every week.
A chart based on old assumptions can fall out of sync with the real system. That can lead to claims that do not cover the final product well.
A better workflow is to use AI to draft the chart, then review every gap with the people closest to the technology. Ask what is proven. Ask what is only likely. Ask what has changed. Ask what the team plans to build next.
This is also why PowerPatent is useful for technical founders. It helps turn raw technical detail into clear patent work, without asking the team to become patent experts.
You get the speed of smart software and the guardrails of real attorney review. Learn more at https://powerpatent.com/how-it-works.
Forgetting that claim charts are built for strategy, not just comparison
A claim chart is not only a table. It is a strategy tool.
Many teams miss this. They use AI to compare claim words against product words, then stop there. That may create a chart, but it may not create insight. A good chart should help answer bigger questions.
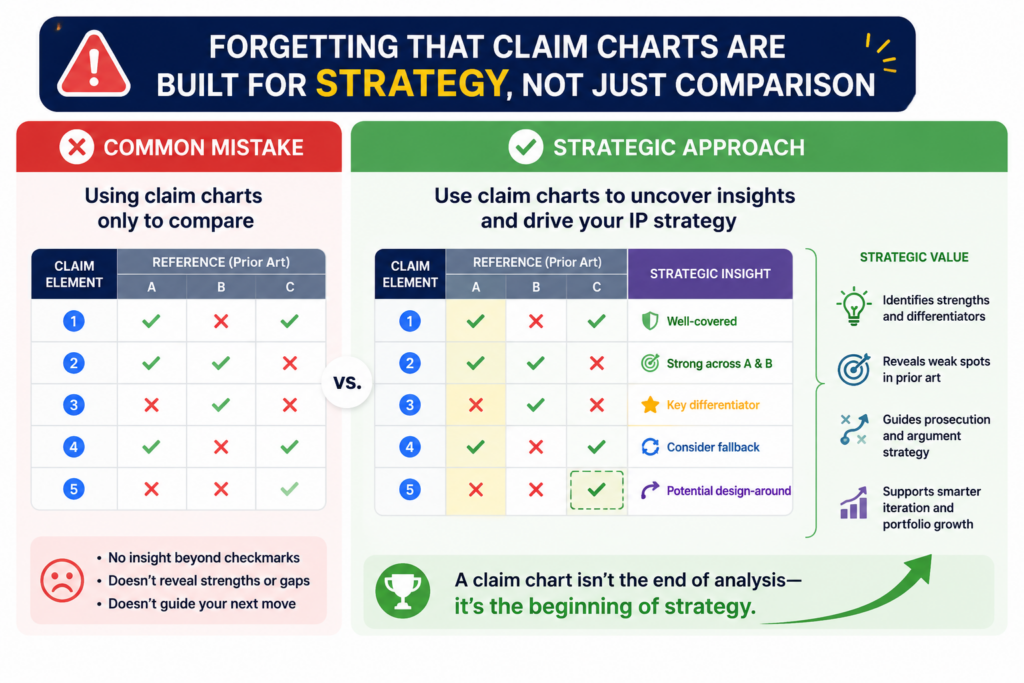
What part of the invention is strongest? What feature gives the startup an edge? What should be protected now? What needs more detail before filing? What parts may be easy for others to copy?
When AI-assisted claim charting is treated as a simple matching task, it can become too shallow. It may show whether a feature appears to line up, but it may not explain why that feature matters.
The best charting work points back to the business
For a founder, patents are not collected for fun. They should support the business.
They should help protect the core product, make fundraising easier to explain, create leverage in partnerships, and reduce the risk that a competitor copies the hard work.
That means the chart should connect to the real company plan.
For example, if the startup is building a new AI system for drug discovery, the chart should not only ask whether a claim maps to a model pipeline. It should ask which part of the pipeline is hard to copy.
It should ask where the data advantage lives. It should ask what customers value most. It should ask whether the patent story covers the part competitors would want to imitate.
AI can help organize the evidence. But it will not automatically know the business reason behind the invention.
Strategy turns claim charting into leverage
When claim charting is done well, it can help a startup make sharper moves. It can reveal that one feature is more defensible than expected.
It can show that a broad claim may need narrower backup. It can expose a missing detail before the filing is prepared. It can help a founder explain the invention in a cleaner way.
This is where many founders get value from working with a system built for startup speed. PowerPatent is not just about drafting words. It is about helping builders protect what matters while they keep moving.
Smart software handles much of the structure. Real attorneys help make sure the strategy does not drift into weak ground. You can explore the process here: https://powerpatent.com/how-it-works.
A chart that does not guide action is just a document. A chart that shows risk, proof, and business value becomes a tool the team can use.
Creating charts that are too vague to be useful
A vague claim chart can look polished and still be almost useless.
This happens when AI writes broad statements that sound right but do not say enough. It may use phrases like “the system appears to include this feature,” or “this is likely shown by the product,” or “the platform performs a similar function.”
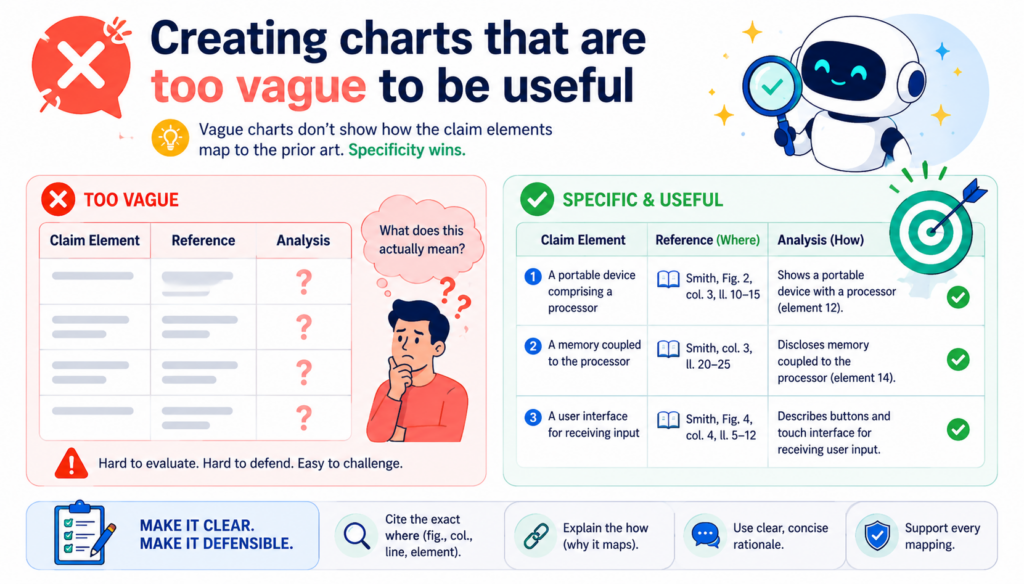
Those lines may be fine as early notes, but they should not be treated as final analysis.
A good chart should be clear enough that someone else can understand the match without guessing. It should show the claim part, the proof, and the reason the proof matters.
If the reader has to do all the work, the chart is not doing its job.
Vague language hides weak thinking
Vague language is often a sign that the match has not been fully checked. This can happen when the AI is unsure, when the source is thin, or when the claim language is hard to parse.
For example, a claim may require “generating a prediction score based on a weighted combination of user behavior data and device state data.”
A vague chart may say the product “uses user data and device data to make predictions.”
That may be close, but it leaves out the weighted combination. It does not explain the score. It does not show how the two data types are used together.
A better chart would say exactly what the source proves and exactly what it does not prove. If the weighted combination is not shown, the chart should not blur that issue.
Clear charts reduce expensive confusion
Clarity is not just about nice writing. It saves time. It helps attorneys review faster. It helps founders see risk sooner. It helps engineers correct errors without reading between the lines.
This matters even more when teams are moving fast. A startup may file patents while the product is still changing. If the chart is vague, the team may not notice that the patent story no longer matches the product.
That can create problems later, especially if the company needs to show investors, partners, or buyers that its IP position is strong.
The fix is simple but important. Use AI for a first draft, then force the chart into plain English.
Each match should answer what the claim requires, what the source shows, and what still needs checking. The words should be direct. The reasoning should be easy to follow.
PowerPatent is built around this kind of founder-friendly patent work. It helps turn complex technical systems into clear patent materials, with software to speed up the process and attorney review to improve trust.
You can see how PowerPatent helps at https://powerpatent.com/how-it-works.
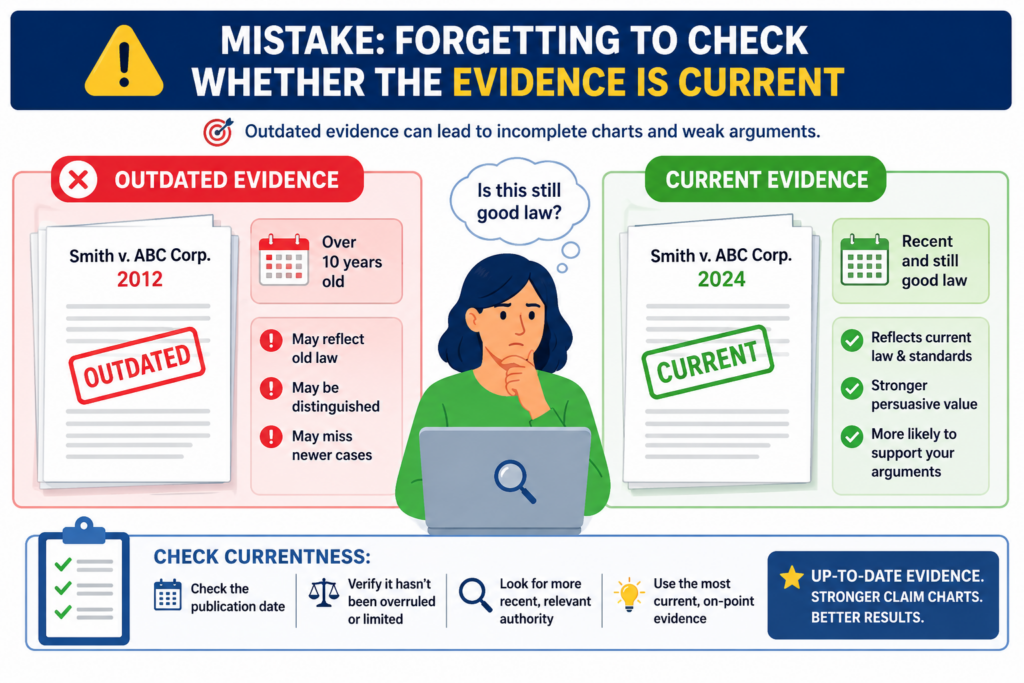
Forgetting to check whether the evidence is current
AI can pull old proof and make it look fresh. This is a quiet problem, but it can hurt the whole chart.
Products change. APIs change. Model behavior changes. Features get removed. Screenshots become outdated. Docs get rewritten. A startup may ship a new version every few weeks.
A larger company may update a system without making a big public note. If the claim chart is based on old material, it may not reflect what the product does now.
This is a common mistake because AI often treats all sources as equal. A page from three years ago may sit next to a recent release note.
A cached doc may be mixed with a live product page. A blog post about a beta feature may be used as proof for a current product. The chart may look neat, but the timing may be wrong.
Old evidence can create false confidence
A claim chart needs to be tied to the right version of the product or system. If the chart is about a current product, the proof should support the current product. If the chart is about an older version, the chart should make that clear.
For example, an AI tool may find a technical blog that says a platform used a certain model routing method in 2022.
But the platform may have changed in 2024. The current system may use a different method. If the chart does not flag this, the team may think the match is stronger than it is.
The issue is not just age. The issue is fit.
A source can be old and still useful if it proves the relevant version. A source can be new and still weak if it only gives high-level marketing language.
The chart needs to show why the source is useful for the exact point being made.
The better way is to date every key source
A strong AI-assisted chart should track dates with care. It should show when the source was published, when it was accessed, and what product version it appears to describe. This does not need to be complex. It just needs to be clear.
When the source is a live web page, save the access date. When the source is a product doc, note the version if one is shown.
When the source is a release note, connect it to the feature date. When the source is a video, capture the date and the relevant timestamp.
This simple habit makes the chart easier to trust. It also makes review faster because the team does not have to guess whether the proof is stale.
For founders, this matters because patent work should support real business action. You do not want to spend time building a patent plan around proof that no longer matches the market.
PowerPatent helps teams move quickly while keeping the work organized, reviewed, and tied to the real invention. You can see how it works here: https://powerpatent.com/how-it-works.
Skipping the technical review from the people who built the system
AI can read documents, but it did not build your product. Your engineers did.
That is why one of the biggest mistakes in AI-assisted claim charting is skipping the technical review. A chart may look complete, but it can still miss the part that matters most.
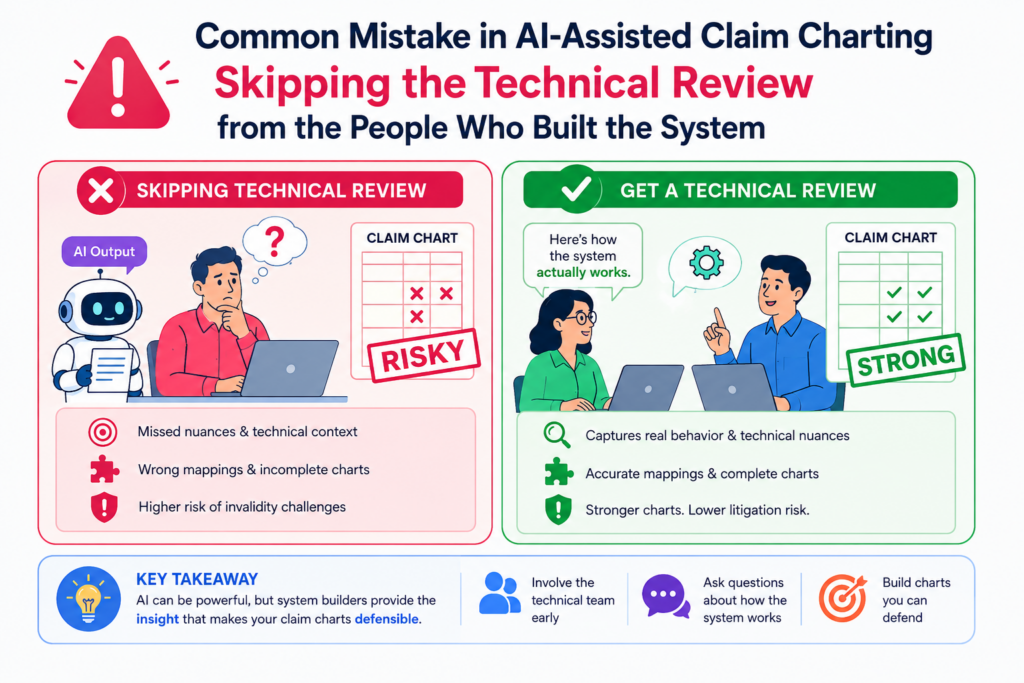
It may describe the wrong model behavior. It may confuse a planned feature with a shipped feature. It may assume a data flow that the system does not use. It may map a claim part to the wrong module.
These are not small errors. They can change the strength of the chart.
The builder knows what the AI cannot see
Many important invention details are not fully written down.
They live in code choices, model design, edge cases, system tradeoffs, and product decisions. AI may not see those details unless they are clearly included in the source material.
For example, your AI product may use a special way to reduce model cost while keeping response quality high. A public product page may only say the system “routes requests intelligently.”
AI may chart that broad phrase against a claim part. But the engineer may know the real method is much more specific and more valuable.
That detail could change the whole patent strategy.
The same is true in robotics, biotech software, chips, security tools, climate tech, and data systems. The key invention is often not the feature users see. It is the hidden way the system solves a hard problem.
The better way is to make review easy for technical teams
Founders should not ask engineers to read long legal documents with dense language. That slows everyone down.
The better approach is to turn each claim part into plain words, then ask the builder to confirm or correct the match.
The review should feel like a product check, not a legal exam.
Ask whether the chart describes the real system. Ask whether the proof is accurate. Ask whether any step is missing. Ask whether the language overstates what is built.
Ask whether there is a better source. Ask whether the invention has changed since the chart was drafted.
This is where PowerPatent fits the way startups actually work. It helps collect technical input in a clearer, faster way, then pairs that speed with real attorney oversight.
Founders get more control without carrying the whole patent burden alone. Learn more at https://powerpatent.com/how-it-works.
Treating all claim parts as equally important
Not every part of a claim carries the same practical weight. Some parts are broad setup language.
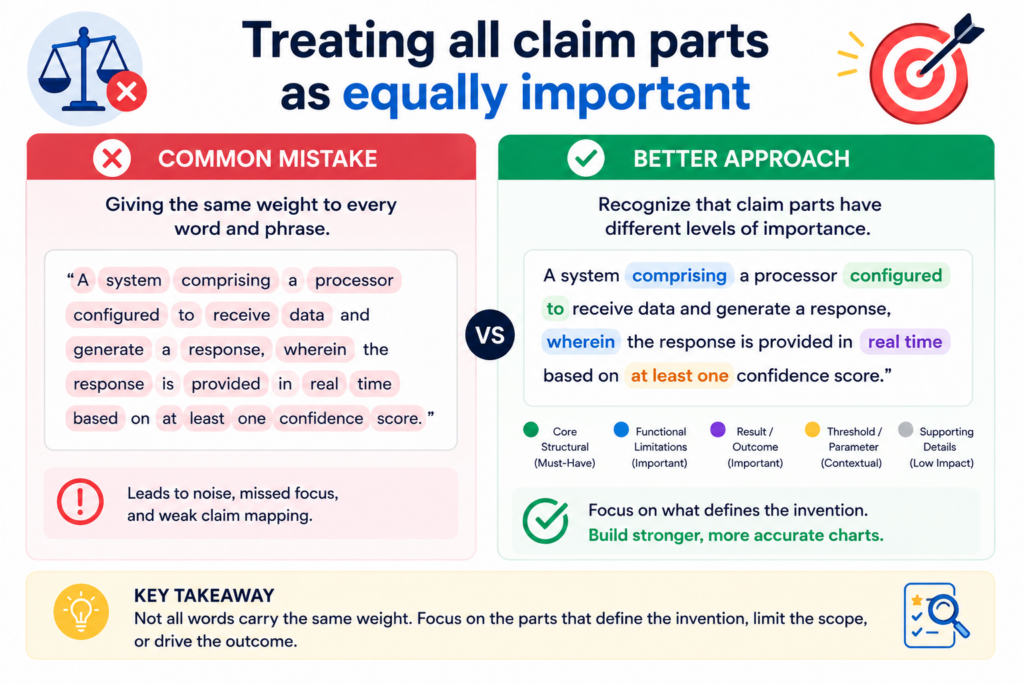
Some parts define the real invention. Some parts are easy to prove. Some parts are the hard center of the whole chart.
AI may not know the difference.
This can lead to charts that spend too much space on easy points and too little time on the parts that matter most.
The chart may give five lines of proof for a basic “processor” or “memory” feature, then give one weak sentence for the real model behavior. That creates a false sense of balance.
A good chart should focus attention where the risk and value are highest.
The hard parts deserve the most care
In AI and software claims, the hard part may be the way data is selected, transformed, ranked, scored, stored, or used.
In hardware claims, it may be how signals move through the system. In biotech or health tech software, it may be how the system connects inputs to a useful result.
AI can spot easy matches quickly. It may find that a product has a server, a database, a model, or a user interface.
But those parts may not tell the real story. The real story is often in the relationship between them.
For example, a claim may require that a system creates a risk score based on both sensor data and past user behavior, then changes a treatment suggestion based on that score.
The basic parts are easy to find. The real question is whether the exact data mix drives the exact output in the claimed way.
That is where the chart needs depth.
The better way is to mark the key claim parts early
Before using AI to draft the chart, the team should identify which claim parts are most important. These are the parts that define the likely point of novelty, the business value, or the hard technical move.
Once those parts are marked, the chart can give them more care. The AI can be asked to find stronger proof.
The reviewer can spend more time checking the logic. The attorney can decide whether the claim language should be adjusted.
This makes the chart more useful. It also helps avoid the common trap of creating a long document that looks complete but does not answer the main question.
PowerPatent helps founders turn this kind of messy technical thinking into clean patent work. The goal is not to make more paperwork.
The goal is to protect the parts of the invention that matter most to the company. See how PowerPatent helps at https://powerpatent.com/how-it-works.
Copying source text without explaining the link
A claim chart should not be a pile of copied text. It should explain the connection.
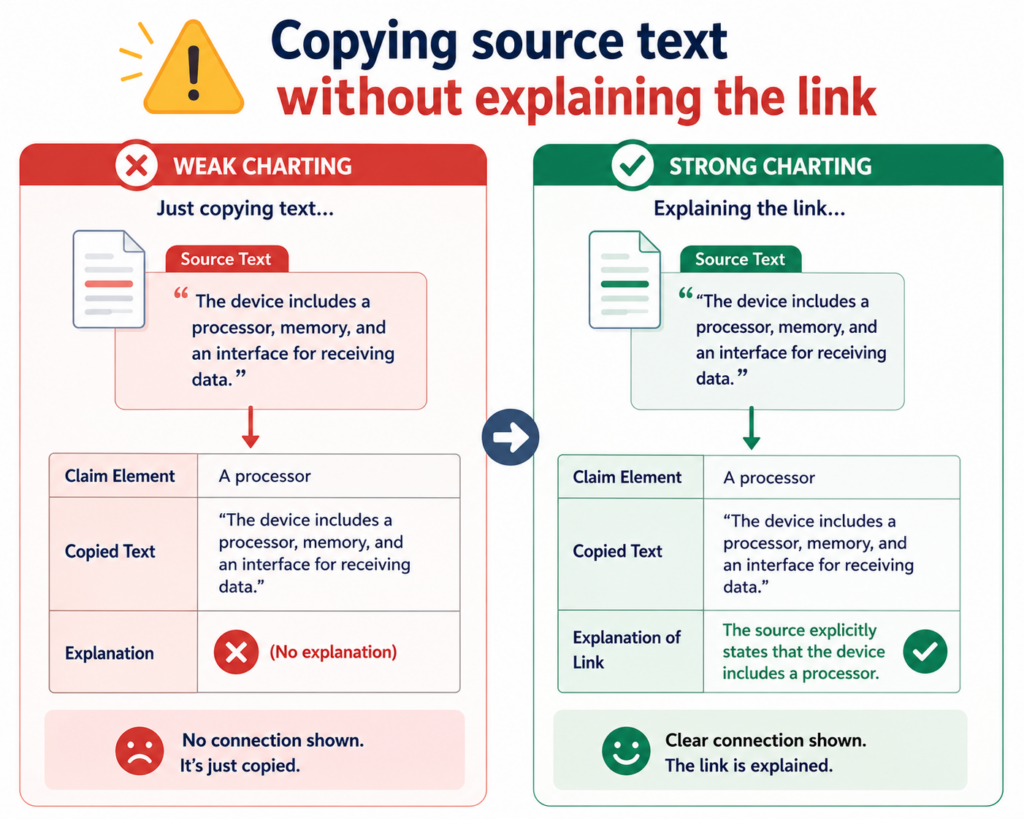
AI can gather source text fast. That is helpful. But when the chart simply drops source language into a table, the reader is left to figure out the match alone. That is not strong charting. It is raw material.
The real value comes from the explanation. The chart should tell a clear story about why the evidence supports the claim part. Without that bridge, even good proof can feel weak.
Quoted text is not the same as analysis
A product doc may include a useful sentence. A paper may include a strong diagram. A code comment may reveal how the system works. But the chart still needs to explain how that proof maps to the claim.
For example, a source may say that a system “assigns each request to a specialized model based on request type and latency needs.” That is helpful.
But if the claim requires selecting a machine learning model based on a user intent score and a resource cost value, the chart must explain whether “request type” maps to intent, whether “latency needs” maps to cost, and whether both are used in the claimed way.
That explanation cannot be skipped.
If the chart only copies the source, the match may look stronger than it is. If the chart explains the link clearly, weak spots become visible. That is a good thing. It helps the team fix the chart, find better proof, or adjust the strategy.
The better way is to add a plain-English reasoning layer
Every important claim part should have a short reasoning note. The note should be written in plain words.
It should say what the claim requires, what the source shows, and why the source supports the match.
This reasoning layer is where human judgment shows up. It is also where AI needs supervision.
AI can draft the note, but a human should check whether the note is fair. The chart should not stretch the source. It should not turn a maybe into a yes.
For startup teams, this plain-English layer is powerful because it makes patent work easier to discuss.
Engineers can check it. Founders can understand it. Attorneys can improve it. Everyone can see where the chart is strong and where it needs more work.
PowerPatent is built around that kind of clear workflow. It helps technical founders move from invention details to strong patent materials without getting stuck in slow, old-school back-and-forth. Explore the process here: https://powerpatent.com/how-it-works.
Missing negative evidence that weakens the chart
AI-assisted claim charting often looks for matches. That makes sense. But a strong review also looks for evidence that cuts against the match.
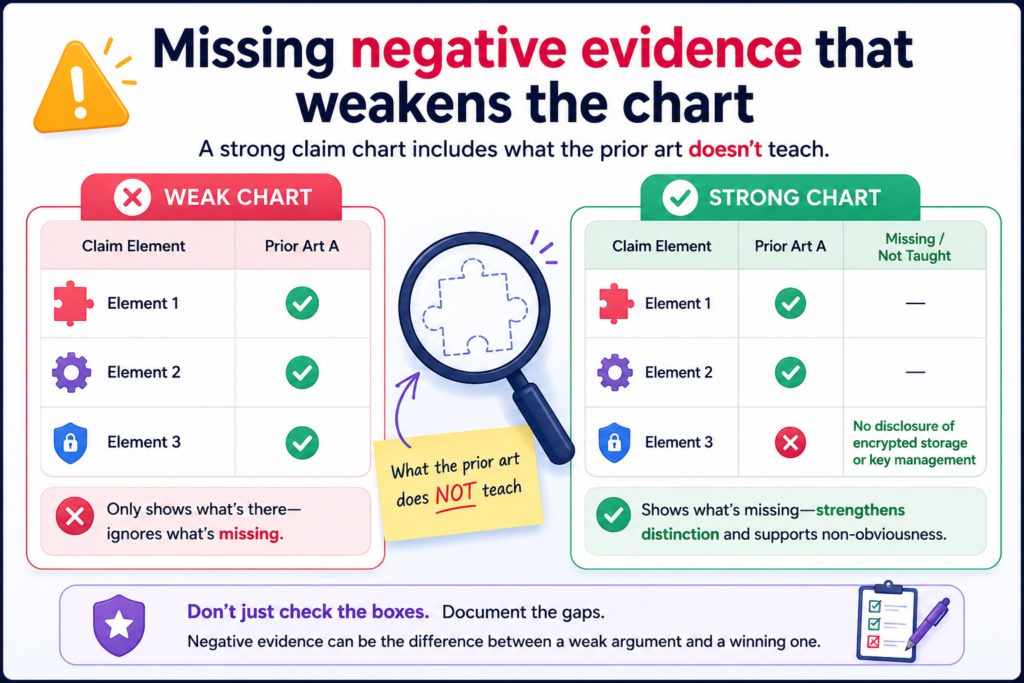
This is easy to miss. The AI may find five sources that seem to support a claim part, but ignore one source that says the product works in a different way. That one source may matter more than all the others.
A chart that only collects helpful proof can become one-sided. It may help the team feel good in the moment, but it can lead to bad decisions later.
Conflicting proof should not be hidden
If a source suggests that a product does not work the way the chart says, the team needs to know. That does not always kill the chart.
Sometimes the source is old. Sometimes it refers to a different product version. Sometimes it is vague. Sometimes it is simply wrong.
But it still needs to be reviewed.
For example, a chart may say a system performs on-device inference. Several sources may mention edge AI, local processing, or device intelligence.
But a technical doc may say that the product sends key data to a cloud server for model output. That conflict matters. The claim match may depend on whether inference happens locally or remotely.
A weak process ignores the conflict. A strong process flags it and works through it.
The better way is to ask AI to search for both support and conflict
When using AI, do not only ask it to find proof that supports a match. Ask it to find proof that may weaken the match.
Ask it to identify sources that suggest a different workflow, a different data path, a different model, or a different timing.
This makes the chart more honest. It also makes attorney review more useful because the reviewer can see the risks early instead of discovering them late.
For founders, this is not about being negative. It is about being smart. You want to know the weak spots before they cost money, slow a deal, or shape the wrong filing plan. A clear view of risk gives you more control.
That is the point of a modern patent workflow. PowerPatent combines smart software with real attorney oversight so founders can move fast without flying blind. See how it works here: https://powerpatent.com/how-it-works.
Failing to separate product facts from legal meaning
AI can help describe what a product does. That is useful. But claim charting needs more than a product description. It also needs a careful link between the product facts and the claim language.
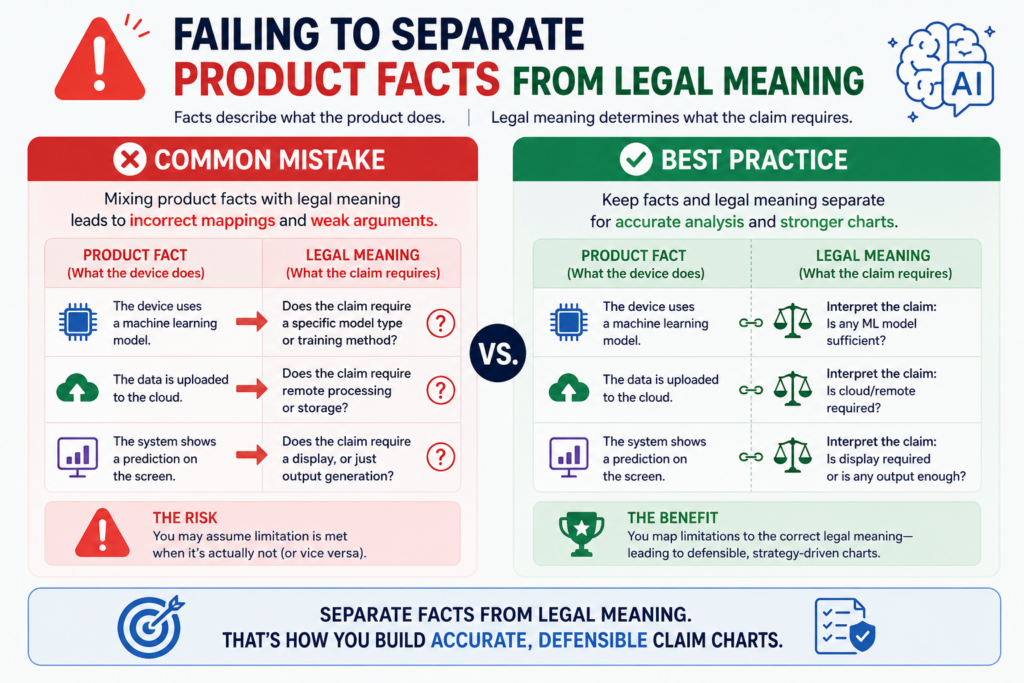
This is where many AI-assisted charts get messy. The AI may find a product feature and then jump straight to a conclusion.
It may say the claim part is met because the product has something that sounds close. But it may not explain the step in between.
That step matters.
A product fact is something like, “The system uses a ranking model to sort candidate results.”
A claim chart conclusion is something like, “This appears to correspond to the claim requirement for generating an ordered set of outputs based on a model score.” Those are related, but they are not the same. The chart should not blur them.
Product facts should stay clean before the chart draws conclusions
The best claim charts keep the raw facts clear. They show what the source actually says. Then they explain how that fact maps to the claim. This makes the chart easier to review and harder to misunderstand.
If the AI blends fact and conclusion together, the chart becomes harder to trust. The reader cannot tell whether the source truly supports the point or whether the AI added a layer of guesswork.
For example, a product page may say a platform “learns from user behavior.” AI may turn that into “the platform trains a machine learning model using user behavior data.” That may be true, but it may also be too much. “Learns from” could mean many things.
It could mean a simple rules update. It could mean analytics. It could mean personalization. It could mean model training. The chart should not choose the strongest meaning unless the source supports it.
Clear separation makes review much faster
A practical fix is to write each chart entry in two parts. First, state the source fact in plain words.
Then explain the possible claim connection. This lets the human reviewer see where the proof ends and where the reasoning begins.
That structure also helps founders. You do not need to become a patent expert to see whether a chart is fair.
You can ask a simple question: did the source actually say this, or did the chart stretch it?
PowerPatent is built to help teams keep that line clear. The platform helps organize invention details and patent work in a way that is easier for founders and engineers to follow, with real attorney oversight added where judgment matters most.
You can learn how that works here: https://powerpatent.com/how-it-works.
Relying on one source when the claim needs a full story
One source is often not enough.
This is especially true for AI-assisted claim charting because many claim parts describe a chain of events.
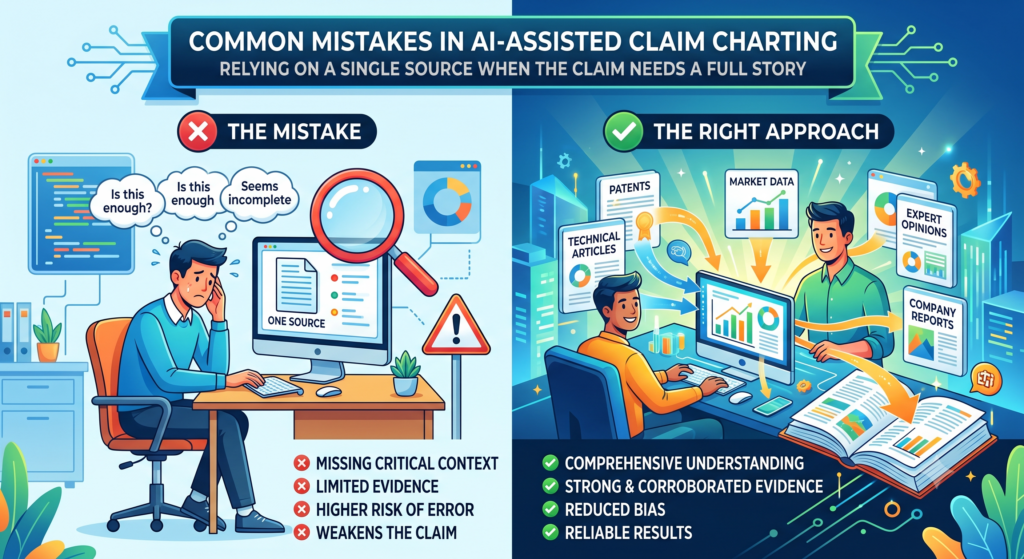
The system receives data, changes it, applies a model, creates an output, and uses that output in a specific way. A single page may show one part of that chain, but not the full flow.
AI may still treat that one source as enough because it found strong words. That can make the chart look cleaner than it should. But a clean chart is not always a strong chart.
Complex claim parts often need several pieces of proof
Some claim parts are simple. If the claim requires a mobile app, and the product page clearly shows a mobile app, that may be easy.
But many important claim parts are not simple. They involve timing, data flow, model choice, feedback loops, or system control.
For those parts, the chart may need proof from several places. A technical doc may show the data input. An API page may show the processing step. A demo video may show the output.
A release note may show when the feature launched. A developer guide may explain the model behavior.
AI can help gather these pieces, but it should not mash them together without care. The chart should explain how the pieces fit.
It should also make clear when the pieces come from different versions, different products, or different settings.
For example, a claim may require that a system sends a warning when a risk score crosses a threshold. A marketing page may say the system “detects risk.” A support page may show alerts.
A technical document may describe the scoring method. None of these alone proves the whole claim part. Together, they may build a stronger case.
The best charts build a chain, not a pile
A pile of sources can still be weak if the chart does not connect them. A chain of sources is different. Each source supports a specific part of the reasoning. The chart shows how one fact leads to the next.
This is very helpful for technical founders because it forces the team to see the invention clearly.
It also helps avoid the trap of overclaiming. If the chain breaks, the team knows exactly where more proof is needed.
That kind of clarity is valuable before filing, before investor talks, before partnership talks, and before any major IP decision.
PowerPatent helps founders build a stronger record of what they invented and why it matters, without dragging them through a slow and confusing process. See the workflow here: https://powerpatent.com/how-it-works.
Using AI to chart claims before understanding the invention
This mistake sounds basic, but it happens all the time.
A team feeds a claim into an AI tool and asks it to make a chart. The tool produces a table. The table looks useful.
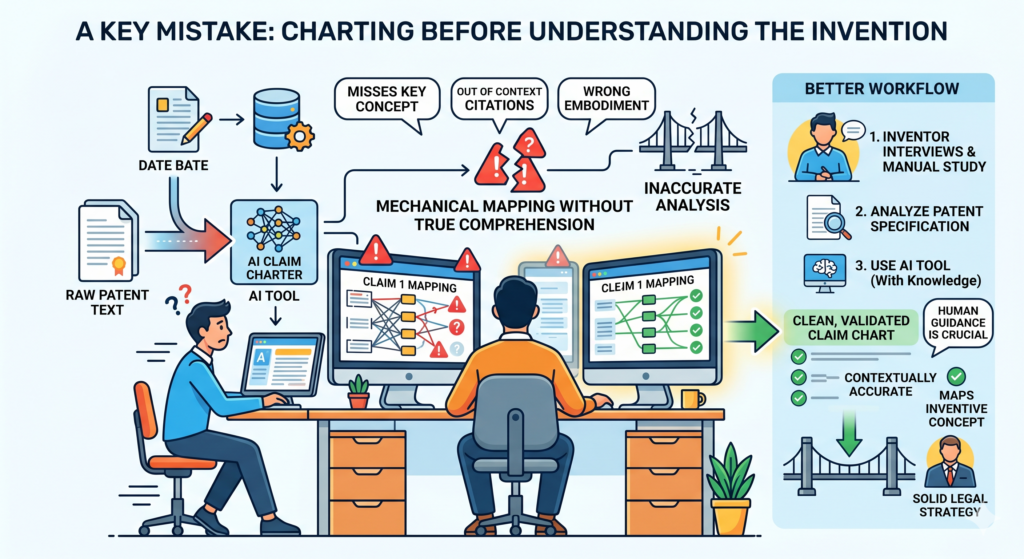
But the team has not first stepped back and asked the most important question: what is the invention really about?
Without that answer, the chart can drift. It may focus on surface features instead of the core idea.
It may compare the wrong things. It may miss the technical move that makes the invention valuable.
AI can only work with the frame you give it. If the frame is weak, the chart will be weak too.
The chart should start with the technical problem and the real solution
Before charting, the team should understand the problem the invention solves. Not in broad business terms, but in real technical terms.
What was hard before? What failed? What was too slow, too costly, too noisy, too large, too risky, or too hard to scale? What did your team build to fix that? What changed in the system because of your work?
These questions make the chart sharper.
For example, a startup may say it built an AI assistant for doctors. That is too broad. The real invention may be a way to reduce false alerts by combining patient history, live sensor data, and context from clinical notes.
That is much more useful. If the claim chart only focuses on “AI assistant,” it may miss the heart of the invention.
This matters because strong patents usually protect the useful technical move, not just the product label.
A short invention brief can save hours of bad charting
Before using AI for charting, write a short invention brief in plain words. Explain the problem, the old way, the new way, the key steps, the main inputs, the main outputs, and why the result is better.
Then use that brief to guide the AI. Ask it to chart with that invention story in mind. Ask it to flag where the evidence supports the core idea and where it only supports background features.
This can make the chart far more useful. It also helps your attorney give better guidance because the review starts from the real invention, not a random table.
PowerPatent helps founders capture this technical story early, while it is still fresh. That means fewer missed details, fewer slow email chains, and a better chance that the patent work protects what the company is actually building. Learn more here: https://powerpatent.com/how-it-works.
Ignoring how competitors may design around the claim
A claim chart can show whether a product appears to match a claim. But smart charting should also ask another question: how easy would it be to avoid this claim?
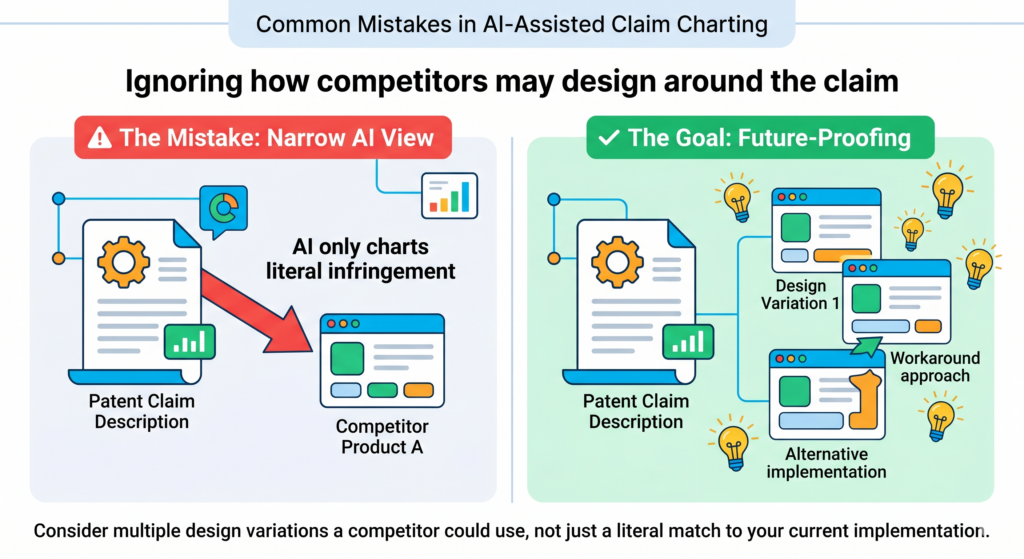
This is one area where AI often falls short. It may focus on matching what exists today, not on how a competitor could change the system tomorrow. For startups, that is a big issue.
A patent should not only describe your current product. It should help protect the space around your key idea.
If a chart is too narrow, it may lead the team toward claims that are easy to dodge.
A chart should reveal both coverage and escape routes
When reviewing an AI-assisted chart, look for claim parts that seem too specific.
A claim may require one exact model type, one exact data format, one exact order of steps, or one exact hardware setup. Sometimes that detail is needed. Other times, it creates an easy path around the claim.
For example, a claim may require using a neural network to rank outputs. If a competitor can use a different model and get the same result, the team should know that.
A claim may require a sensor placed in one location. If a competitor can move the sensor and keep the same benefit, that matters too.
The chart should help spot these design-around paths. It should not only ask whether a product matches. It should ask whether the claim is written in a way that protects the real value.
Strong charting helps shape better patent claims
The best time to find design-around risk is early. If the team sees that a claim is too narrow, the patent strategy can be adjusted before too much time and money are spent.
This does not mean every claim should be broad in a vague way. Broad claims still need support. The goal is to protect the invention at the right level.
You want claims that are clear, supported, and hard for a competitor to avoid without giving up the key benefit.
AI can help brainstorm possible design-arounds. But a human team should review them with care. Engineers know what alternatives are realistic.
Attorneys know how those alternatives may affect claim scope. Founders know which features matter most to the market.
This blend is where PowerPatent stands out. It helps startups move fast, but not blindly.
The software supports the work, and real patent attorneys help founders make stronger IP choices. You can see how the process works at https://powerpatent.com/how-it-works.
Letting the chart become too long to use
A long chart is not always a better chart.
AI can produce a lot of text very quickly. That can feel productive, but it can also create a new problem. The chart becomes so long, dense, and repetitive that no one wants to read it.
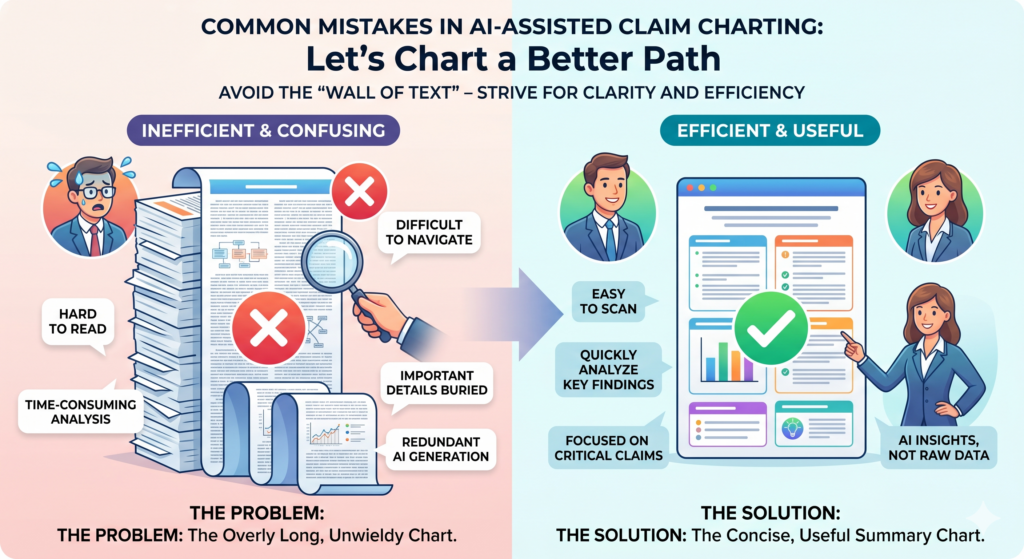
Engineers avoid it. Founders skim it. Attorneys have to dig through extra words to find the real issues.
A claim chart should be useful. If it becomes a wall of text, it stops helping.
More words can hide the important parts
AI-generated charts often repeat the same source text across several claim parts.
They may include long quotes, broad summaries, and extra filler language. The result looks detailed, but the detail may not add value.
A strong chart should be tight. It should give enough proof to support the match, enough explanation to make the reasoning clear, and enough notes to flag risk. It should not bury the reader in every possible sentence the AI found.
For example, if one technical document explains a data processing pipeline, the chart does not need to paste the same full paragraph five times.
It can cite the source clearly, use the relevant part for each claim element, and explain the connection in fresh, direct language.
This makes the chart easier to review and easier to improve.
A useful chart is written for action
The goal of a claim chart is not to impress people with length. The goal is to help people make better decisions.
A useful chart should help the founder see the main risk. It should help the engineer check the facts.
It should help the attorney refine the patent strategy. It should help the team decide what to file, what to fix, and what to protect next.
That means every section of the chart should earn its place. If a sentence does not support proof, reasoning, or strategy, it should be removed. If a note does not help someone act, it should be rewritten or cut.
This is the kind of practical patent work founders need. Not endless documents. Not slow back-and-forth.
Not confusing legal language. Just clear work that helps protect the company while the team keeps building.
PowerPatent gives startups a faster way to turn real technical work into stronger patent protection, backed by smart software and real attorney review. Explore how it works here: https://powerpatent.com/how-it-works.
Not checking whether the chart matches the right claim version
AI-assisted claim charting can go wrong before the first match is even made. One of the most basic but costly mistakes is using the wrong claim version.
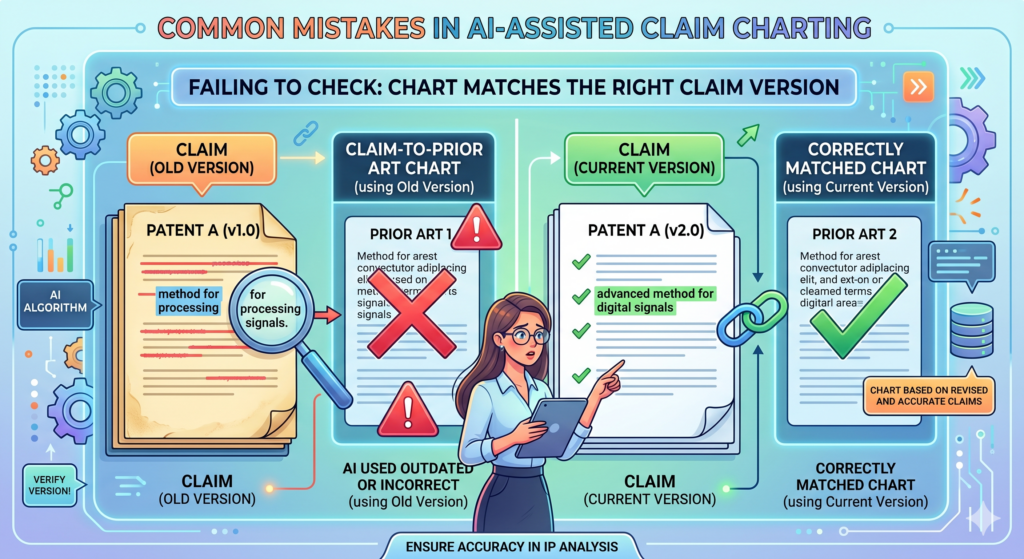
This happens more often than founders expect, especially when a patent draft has gone through several rounds, a filing has changed over time, or a team is comparing claims from different family members.
A small claim change can change the whole chart. One added phrase can narrow the meaning. One removed phrase can make the claim broader.
One reordered step can shift the analysis. If the AI is charting against an old claim, the output may look useful but guide the team in the wrong direction.
Claim versions need the same care as product versions
Technical teams already understand version control. They know that one branch of code may not match another branch.
Claim charting needs the same mindset. The chart should always make clear which claim set is being used.
This matters because claim language often changes during drafting and review. A founder may start with a broad idea. Then the attorney may refine it. Then the team may add fallback claim language.
Then new product details may come in. If the chart does not stay linked to the right claim version, the team may review work that no longer matters.
For example, an early claim may describe “generating a model output.” A later version may say “generating a ranked model output using a confidence score.” Those are not the same.
A chart built on the first phrase may miss the ranking and confidence score requirements in the later claim.
A clean claim record prevents wasted work
The better approach is to label every chart with the claim version, date, and purpose.
The chart should state whether it is based on a draft claim, a filed claim, an issued claim, or a proposed new claim. That simple habit keeps everyone aligned.
When AI is used, the prompt should include the exact claim language being charted. Do not ask the tool to rely on memory or prior drafts.
Paste the current claim. Confirm the claim number. Confirm the version. Then have a human check that the chart matches the right text.
This is one reason founders benefit from using a guided patent workflow instead of scattered files, emails, and generic AI prompts.
PowerPatent helps keep invention details, drafts, and attorney review moving in one clearer process, so teams do not lose control as the patent work changes. See how it works here: https://powerpatent.com/how-it-works.
Letting AI overstate the strength of a match
AI often writes in a polished, confident way. That can make weak matches feel stronger than they are.
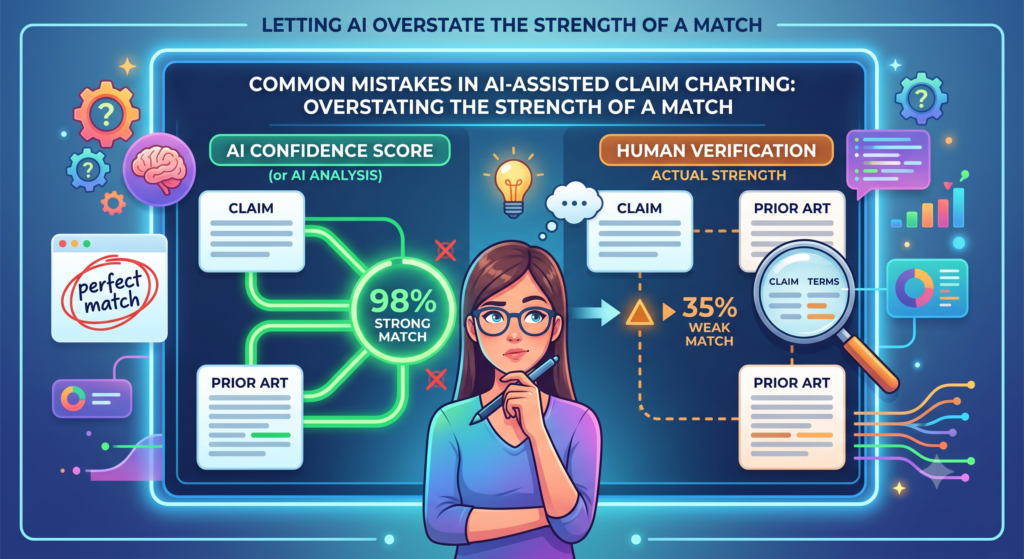
In claim charting, this is a real problem because the tone of the chart can shape how people read the evidence.
A chart should not sound stronger than the proof. If the evidence is partial, the chart should say that.
If the match depends on an assumption, the chart should say that. If the source only suggests a feature but does not prove it, the chart should say that too.
When AI turns soft proof into firm language, it gives the team false comfort.
Confidence should come from evidence, not wording
A strong claim chart does not need dramatic language. It needs clear proof. Words like “clearly,” “definitely,” and “undoubtedly” should be used with great care. In many cases, softer language is more honest.
For example, if a source says a product “may use behavioral signals to improve recommendations,” the chart should not say the product “uses behavioral signals to generate recommendations as required by the claim.”
That changes the meaning. “May use” is not the same as “uses.” “Improve” is not always the same as “generate.”
This kind of overstatement can slip into AI-generated charts because AI tries to complete the pattern. It sees a close match and writes the most direct conclusion.
But charting is not about making the chart sound done. It is about showing what can truly be supported.
A strength label can keep the team honest
One practical fix is to add a strength note for each important claim part.
The note can explain whether the proof is strong, partial, unclear, or missing. This does not need to be complex. It just needs to tell the truth.
A strong match has direct proof. A partial match has some proof but not enough. An unclear match needs more review. A missing match should not be dressed up as support.
This helps founders act faster because they can see where the risk is. They do not need to read every word to know which parts need more work.
Engineers can focus on the unclear technical issues. Attorneys can focus on the parts that affect claim scope and filing strategy.
PowerPatent helps founders move this way: fast, clear, and grounded. The goal is not to make patent work look good on the surface.
The goal is to build protection that can stand up when it matters. You can learn more here: https://powerpatent.com/how-it-works.
Missing the difference between planned features and shipped features
Startups move fast. A feature may be planned on Monday, built on Friday, tested next month, and changed again after customer feedback.
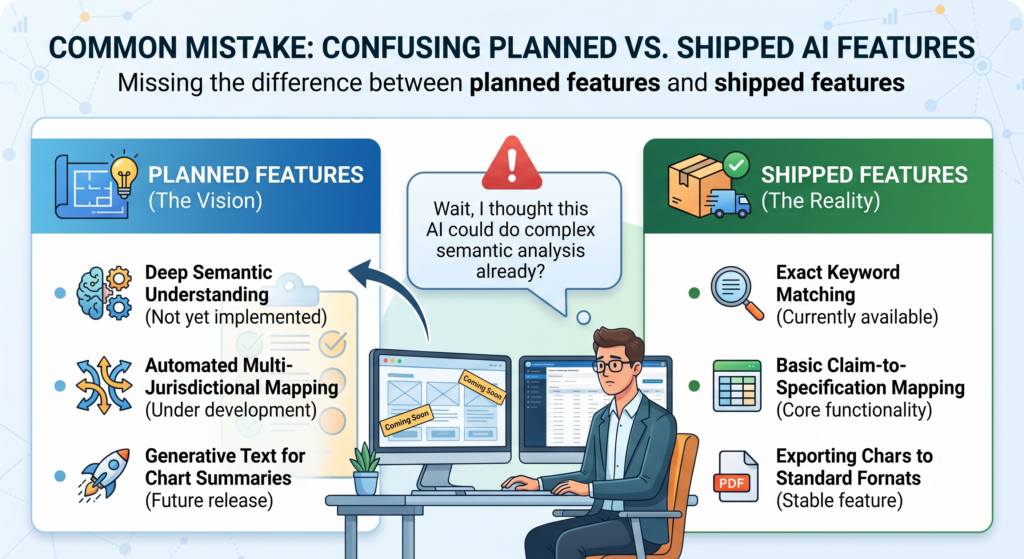
That is normal. But in claim charting, planned features and shipped features should not be mixed without clear labels.
AI can easily blur this line. It may read a product roadmap, a pitch deck, a design note, and a public product page, then treat all of them as if they describe the same thing. That can make the chart confusing or misleading.
A claim chart should be clear about what exists now, what is planned, and what is only a design idea.
Product status changes the meaning of the chart
For patent planning, future features can be very important. A startup may want to file before launch.
It may want to protect a system that is still being built. That can be smart. But the chart must say what kind of evidence it is using.
A shipped product page may support what customers can use today. A design document may support what the team invented and plans to build.
A roadmap may show business intent, but it may not prove technical details. A prototype may show feasibility, but it may not match the final product.
For example, a claim may require a feedback loop that updates a model after each user session. The roadmap may say this is planned.
The current product may only collect feedback without model updates. If the chart does not separate those facts, the team may think the current product is covered when it is not.
Good labels make patent planning safer
The fix is simple. Each source should be labeled by status. Is it current product proof? Prototype proof? Planned feature proof? Internal design proof? Public proof? The answer matters.
This helps the team choose the right patent path. If the invention is planned but not shipped, the patent application may need strong technical detail from the inventors.
If the feature is already public, timing may matter. If the product has changed, the filing should reflect the version that matters most to the business.
PowerPatent is built for this kind of fast-moving startup reality. It helps founders capture invention details while they are fresh, organize the technical story, and work with real patent attorneys who can guide the filing path. See the process here: https://powerpatent.com/how-it-works.
Conclusion
AI-assisted claim charting can save time, but only when it is used with care, proof, and human judgment. The goal is not to make a chart that looks complete. The goal is to build a clear, honest map that helps founders protect what truly matters. AI can find clues, organize facts, and speed up review, but real strength comes from checking sources, testing assumptions, and tying each claim to the real invention.
With PowerPatent, startups get smart software plus real attorney oversight, so they can move fast without making costly patent mistakes. Learn how it works here: https://powerpatent.com/how-it-works