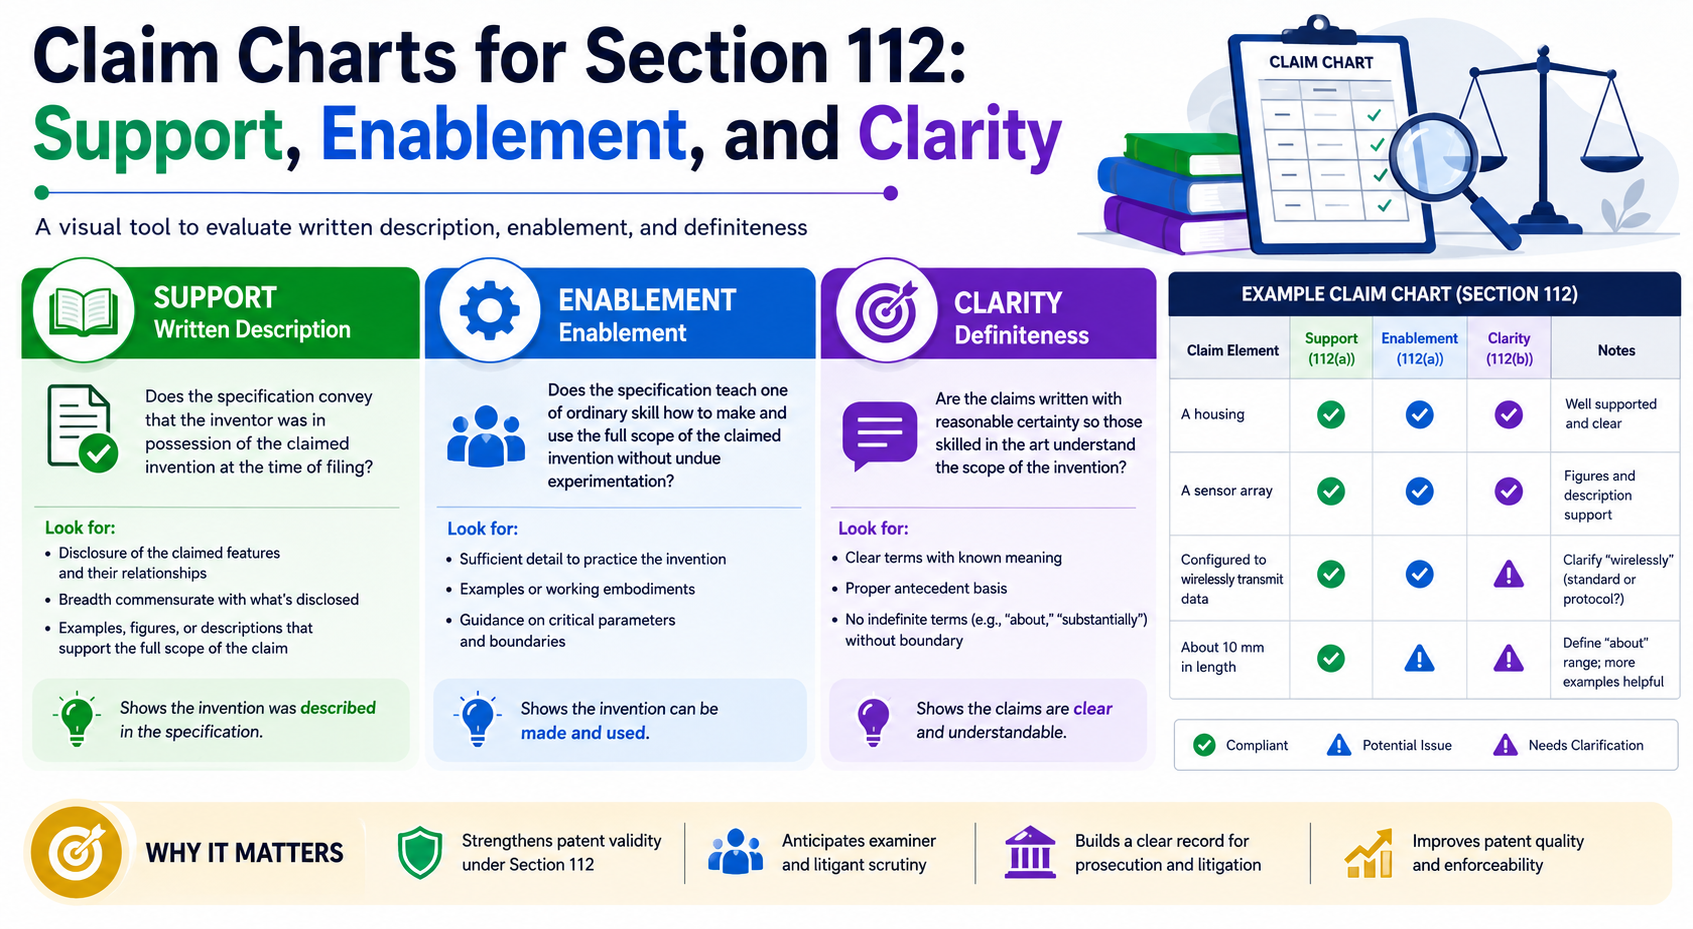
A strong patent does not start with clever words. It starts with proof. Section 112 is where that proof gets tested. In plain terms, it asks three hard questions. Did you show that you really had the invention? Did you explain it well enough so another skilled person could make and use it? Did you write the claims clearly enough so people can tell what is covered? The USPTO treats written description, enablement, and best mode as separate rules under Section 112, and enablement is also separate from written description.
A Section 112 Claim Chart Shows Whether the Patent Story Can Hold Weight
A claim chart for Section 112 is not just a table. It is a stress test for the patent. It shows whether each part of a claim is backed by the patent draft, the drawings, the examples, the system flow, and the real work done by the team.
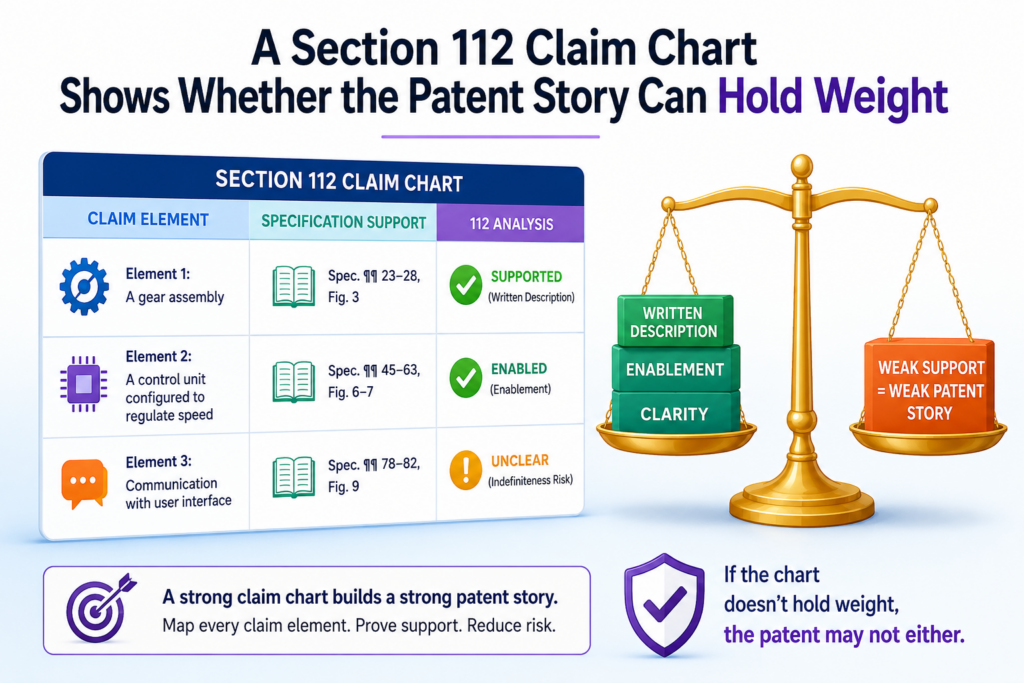
For a founder or engineer, this matters because weak support often hides in plain sight. A claim may sound strong, broad, and smart.
But when someone asks, “Where did you explain that exact feature?” the answer may be thin. That is when trouble starts.
Section 112 asks the patent draft to do more than describe a cool idea. It must show that the inventor had the invention, teach how to make and use it, and set clear claim lines.
The USPTO treats written description, enablement, and best mode as separate parts of the specification requirement under 35 U.S.C. 112(a).
It also treats claim clarity, often called definiteness, as a separate issue under 35 U.S.C. 112(b).
A good chart brings these issues out early. It does not wait for an office action. It does not wait for a competitor.
It does not wait for a funding round where investors start asking if the patent has real depth. It gives the team a clean view before the patent becomes expensive to fix.
That is why PowerPatent puts speed and control at the center of the process. Founders should not have to guess whether their invention is covered.
They should be able to see the support, review it with real patent attorneys, and move forward with more confidence. You can see how that works here: https://powerpatent.com/how-it-works
A claim chart should connect every claim idea to the exact place where the draft supports it
A Section 112 claim chart works best when it is simple. On one side, you place the claim language. On the other side, you point to the exact support in the patent draft.
That support may come from the written description, a figure, a flow diagram, a data example, a model step, a training process, a hardware layout, or a user action.
The chart should not say, “This is generally described.” That is too soft. It should say where the support lives and why that support is enough.
A strong chart reads like a map. Anyone on the team should be able to follow it without a long call or a legal lecture.
For example, a claim may say that a system “scores input data using a trained model.” The chart should point to where the draft explains the model, what input data means, how the scoring works, what the score does, and how the system uses the score.
If the draft only says “AI may be used,” that may not be enough. The chart exposes the gap before the patent is filed.
This is especially useful for deep tech teams. Many inventions live in code, math, cloud systems, chips, sensors, data pipelines, or model workflows.
The real invention may be spread across commits, design docs, notebooks, test logs, and product specs. A claim chart helps turn all of that into clean patent support.
The safest chart starts with the claim words and then follows the proof trail through the draft
The first mistake many teams make is starting with the invention story instead of the claim words. The story is helpful, but the claim is what gets tested.
Each word in the claim can matter. If a claim says “generate,” “rank,” “select,” “train,” “detect,” “route,” “encrypt,” or “adjust,” the chart should show where that action is described.
This does not mean the patent draft must use the exact same words every time. But the link must be clear.
A reader should not have to guess. The chart should show that the claimed feature is not being added later as an afterthought.
Written description is about showing that the inventor actually had the claimed invention.
The USPTO guidance explains that the specification must describe the claimed invention in enough detail so a skilled person can reasonably conclude the inventor had possession of it.
That simple idea has a hard edge. If the claim is broader than the draft, the chart will show it. If the claim covers five versions but the draft only describes one, the chart will show it.
If the claim uses a key term that never appears in the draft, the chart will show it. That is the value.
A strong Section 112 chart is not made to decorate a file. It is made to find risk. It helps your patent team decide whether to add more detail, narrow a claim, add examples, define a term, explain a step, or capture more versions of the invention before filing.
For a startup, that can save real money. It can also protect speed. Fixing support before filing is usually much easier than trying to patch the story later.
Once the application is filed, new matter limits can make late fixes hard or impossible. The better move is to build the support map early, while your team still has room to shape the draft.
A written description chart should prove that the invention was real when you filed
A written description claim chart answers a simple question: did the patent draft show that the inventor truly had the invention at the time of filing?
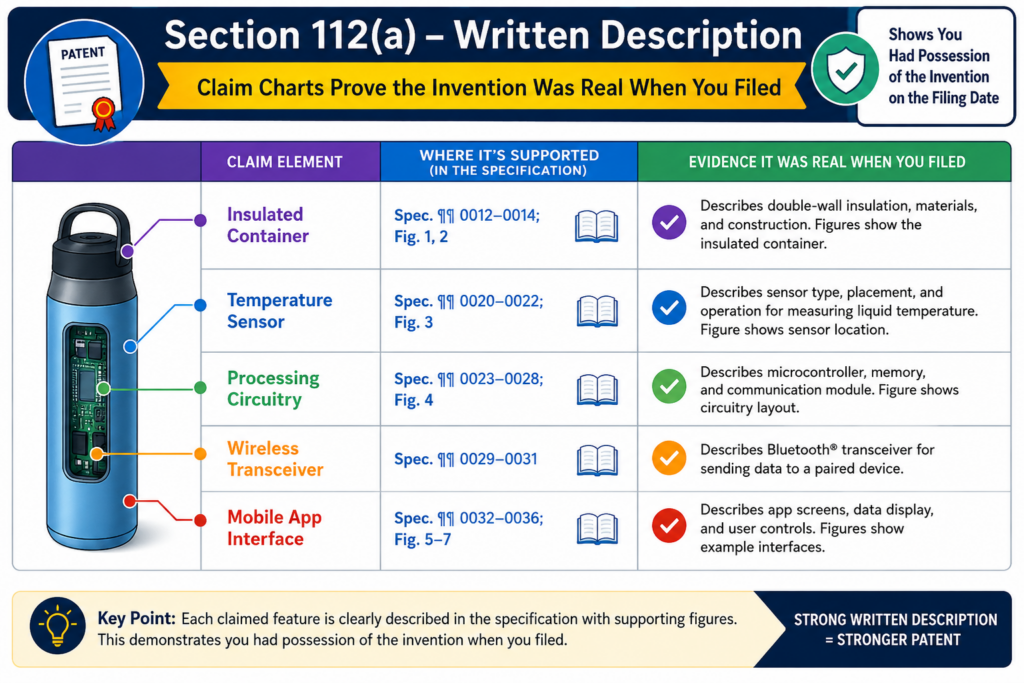
This is not about sounding smart. It is about proof. The chart should show that each claim part is backed by real detail in the patent text, drawings, flow steps, examples, and system design.
The USPTO’s written description guidance focuses on whether the application shows that the inventor had possession of the claimed invention, not just a wish or a broad goal.
For a startup, this is a big deal. A team may build something fast, change the product every week, and file a patent while the tech is still moving.
That is normal. But the patent still has to show the invention clearly. If the claim says more than the draft supports, the claim can become weak. A written description chart catches that mismatch early.
PowerPatent helps founders turn real invention work into patent-ready support, with smart software and real attorney oversight.
That means your draft can be checked against your claims before small gaps become big problems. You can see how the process works here: https://powerpatent.com/how-it-works
A strong chart does not let broad claim words float without support
Broad claim language can be useful. It can help protect more than one version of the invention. But broad words need a strong base. A claim should not reach across a large area if the patent only explains one tiny example.
Say your claim covers “a model trained using sensor data from a device.” That may sound fine. But the chart should ask what kind of sensor data is shown. Is it motion data, image data, sound data, heat data, pressure data, or something else?
Does the draft explain one device or many devices? Does it show how the data is cleaned, labeled, weighted, or used? Does it explain the training setup in enough detail to support the full claim scope?
This is where the chart helps engineers and patent teams speak the same language. Engineers know what the system does. Patent teams know what the claims need. The chart becomes the bridge.
The best written description proof often comes from plain technical detail, not fancy patent wording
Founders sometimes think the patent needs more legal language. Often, it needs more real detail.
The chart should look for working examples, system steps, data paths, user actions, model inputs, model outputs, hardware parts, software modules, control logic, and fallback cases. These details show that the invention was not just an idea. They show how the invention lives in the real system.
A helpful written description chart may point to where the draft explains the problem, the old way, the new way, and the reason the new way works better. It may also point to different versions of the same idea.
For example, if the claim covers a cloud version and an edge device version, the chart should show both. If the claim covers several model types, the draft should not only explain one model and hope the rest are assumed.
This matters most when the patent is meant to protect future product growth. Startups do not file patents only for the current demo.
They file because the invention may become a platform, a core feature, a moat, or a reason investors take the company more seriously.
A written description chart helps make sure the patent is not too narrow for where the company is going, and not too broad for what the draft can support.
An enablement chart should show that a skilled person could make and use the invention
Enablement is different from written description. Written description asks whether the inventor had the invention.
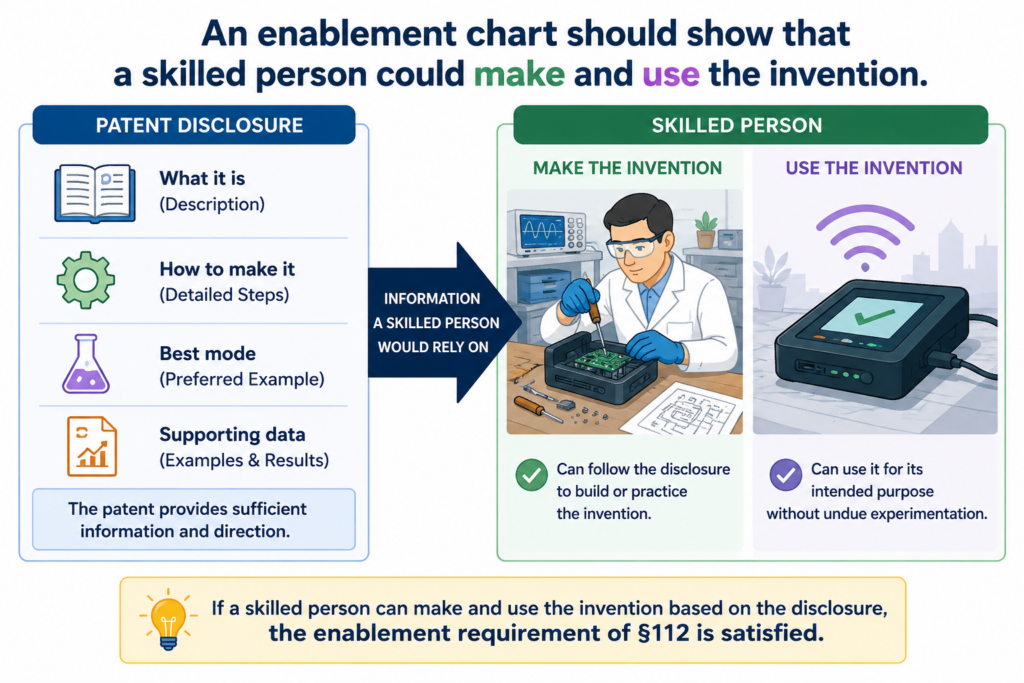
Enablement asks whether the patent teaches enough so a skilled person could make and use it without too much extra trial and error. The USPTO states that enablement is separate from written description under Section 112(a).
That difference matters. A draft can show that you had an idea but still fail to teach how to build or use it.
A claim chart for enablement looks for teaching. It asks whether the patent gives enough steps, parts, settings, examples, and context to make the invention work.
This is especially important for software, AI, robotics, medical devices, chips, clean tech, and other deep tech fields. In these areas, a few missing details can change everything.
A model may need a certain input format. A device may need a certain sensor layout. A control system may need a safety rule. A chip may need a timing path. A claim chart helps you find those details before the examiner, investor, buyer, or competitor does.
The enablement chart should test the claim like a build plan
A useful enablement chart does not ask, “Does the draft mention this feature?” It asks, “Could a skilled person build and use this claimed feature from what the draft teaches?”
That is a tougher test. It also gives better answers.
If a claim says the system “adjusts a threshold based on live user behavior,” the chart should point to how the system receives behavior data, how it measures that data, how the threshold changes, when the change happens, and what happens after the threshold changes.
If the draft only says “the system may adjust values,” that may be too thin.
The chart should also watch for hidden steps. Engineers often skip steps because they feel obvious. They know the pipeline. They know the default settings.
They know why a certain method works. But a patent reader may not know those things. The chart helps pull that know-how out of the team’s head and into the draft.
The most useful enablement gaps are the ones you find before filing
Enablement gaps can be quiet. The claim looks clean. The draft sounds complete. Everyone feels good. Then someone tries to map the claim to the patent, and the chart shows missing teaching.
That is not bad news. That is a gift.
A gap found before filing can often be fixed. The team can add a working example. The team can explain a data flow. The team can add a figure. The team can describe the model training process in simple steps.
The team can state useful ranges, options, inputs, outputs, rules, and system behavior. After filing, adding that kind of detail may not be allowed if it counts as new matter.
This is why a claim chart is not only a legal tool. It is a product memory tool. It saves the details that make the invention real. It helps the patent reflect the work the team actually did, not just the high-level pitch.
PowerPatent is built for this kind of work. Founders and engineers can move fast, while the patent process stays grounded in real technical support.
With software plus attorney review, the path from invention to filing becomes clearer and less painful. Learn more here: https://powerpatent.com/how-it-works
A clarity chart should make the claim easy to understand before anyone argues about it
Clarity is where many claims get into trouble. A claim may have support. It may even teach enough. But if the words are unclear, the claim can still be challenged.
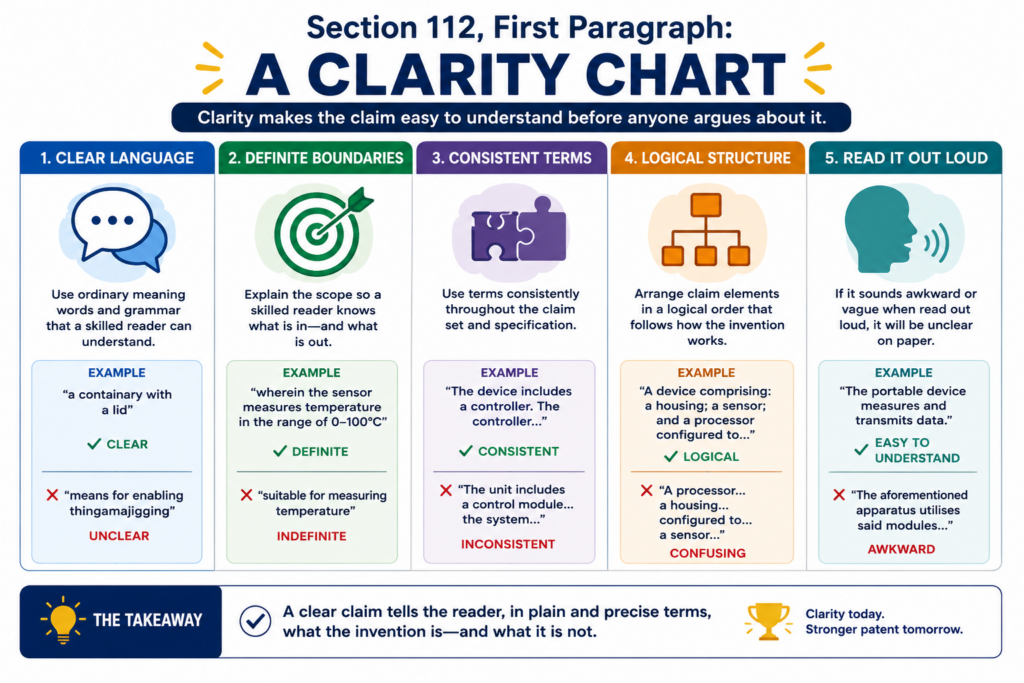
Section 112(b) requires claims to point out and distinctly claim the invention. The USPTO explains that this is often called the definiteness requirement.
The Supreme Court has also explained that claims must inform skilled readers about the scope of the invention with reasonable certainty when read in light of the patent and file history.
In simple terms, people should be able to tell what is inside the claim and what is outside it. That does not mean every word must be perfect. Language has limits. But the claim should not leave key boundaries foggy.
A clarity claim chart helps by testing each claim term before it becomes a fight. It asks whether the draft explains the term, whether the term has a clear role, and whether the claim language matches the support.
Clear claims reduce risk because they leave less room for confusion
Founders often want broad claims. That makes sense. A patent that is too narrow may not protect enough. But broad is not the same as vague.
A broad claim can still be clear. A vague claim is different. It uses words that sound flexible but do not tell the reader where the line is.
Terms like “optimized,” “smart,” “fast,” “secure,” “dynamic,” “high quality,” or “near real time” may be useful in normal product talk, but a claim chart should ask what they mean in the patent.
For example, if a claim says “a secure connection,” the chart should point to what makes it secure. Is it encryption? Token checks? Key exchange?
Access rules? Device identity? If the claim says “near real time,” the chart should check whether the draft gives timing context or system behavior that makes the phrase understandable.
This is not about making the patent small. It is about making it harder to attack.
The clarity chart should flag words that sound good but do not draw a clean line
The best way to test clarity is to read the claim like a competitor would. Ask what they could argue. Ask where they could pretend not to understand. Ask whether the claim depends on a moving target.
A good chart may flag relative terms, missing antecedent basis, unclear actor steps, mixed system and method language, vague result words, unsupported shortcuts, or terms that appear only in the claims and not in the written description.
The goal is not to panic. The goal is to fix the claim while there is still time.
For software and AI patents, this is very important. A claim may say a module “learns,” “infers,” or “predicts.” Those words can be fine when supported.
But the chart should show what the module receives, what it does, what it produces, and how the result is used. Clear words help the claim feel less like a black box and more like a real invention.
Clarity also helps the business side. Investors, buyers, partners, and future team members should be able to understand the patent story without needing hours of translation.
When your claims are mapped cleanly, your IP becomes easier to explain. That can help during diligence, deals, licensing talks, and internal planning.
A practical Section 112 chart should be built from the draft, the claims, and the invention evidence
A claim chart is only as good as the material behind it. If the chart is built from a weak draft, it will show weak support. If it is built from real invention evidence, it can help make the patent much stronger.
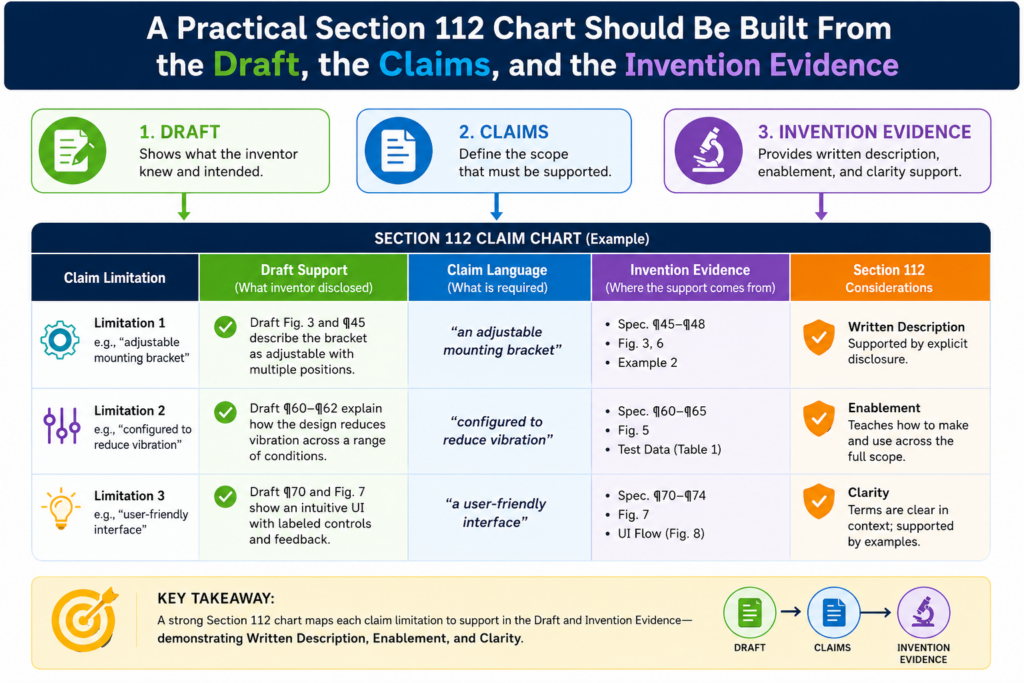
For a startup, invention evidence may live in many places. It may be in Git commits, design docs, model cards, test notes, lab records, CAD files, issue tickets, screenshots, whiteboard photos, architecture diagrams, customer pilots, or internal product specs.
The claim chart helps turn that scattered work into a clean support record.
This does not mean every internal note goes into the patent. It means the patent team should understand the real invention deeply enough to write the right support.
The chart becomes the tool that compares the claim language to the draft and to the invention facts.
PowerPatent makes this step easier by helping technical teams organize invention material, move faster through drafting, and still get real attorney review.
That is the mix founders need: speed without blind spots. See how it works here: https://powerpatent.com/how-it-works
The chart should start with claim parts, not with long legal notes
The most practical chart starts small. Take one claim. Break it into meaningful parts. Then map each part to the draft.
For each part, the chart should show where the draft supports it, whether the support is strong or weak, and what should be improved.
The chart should not become a giant pile of copied text. It should help the team make decisions.
For example, if a claim includes a data intake step, a model step, a ranking step, and an output step, the chart should trace each one. Where does the draft describe the input?
Where does it describe the model? Where does it explain the ranking? Where does it show the output? Where does it explain why the output matters?
This kind of chart is simple, but it is powerful. It shows whether the draft has a real spine.
The chart should create action items that make the patent stronger
A chart that only says “supported” or “not supported” is not enough. The best chart tells the team what to do next.
If support is thin, the action may be to add an example. If the claim is too broad, the action may be to add more versions or adjust the claim.
If a term is unclear, the action may be to define it in the draft or use a cleaner word. If a step feels like magic, the action may be to explain the mechanism in plain terms.
This is where founders get the most value. They do not need a patent process that hides behind legal talk.
They need a process that says, “Here is the risk, here is why it matters, and here is what we can do now.”
The action side of the chart also helps teams avoid delay. Instead of waiting until the end of drafting to fix everything, the patent team can improve the draft as the chart develops. That keeps the work moving and reduces the chance of a last-minute scramble.
A good chart also helps keep the claims honest. Some claims should be broad. Some should be narrow.
Some should protect the core system. Some should protect key versions. Some should protect fallback designs. The chart helps decide that mix with more care.
A strong claim chart helps founders file with more confidence and fewer blind spots
A Section 112 claim chart gives founders something rare in the patent process: a clear view.
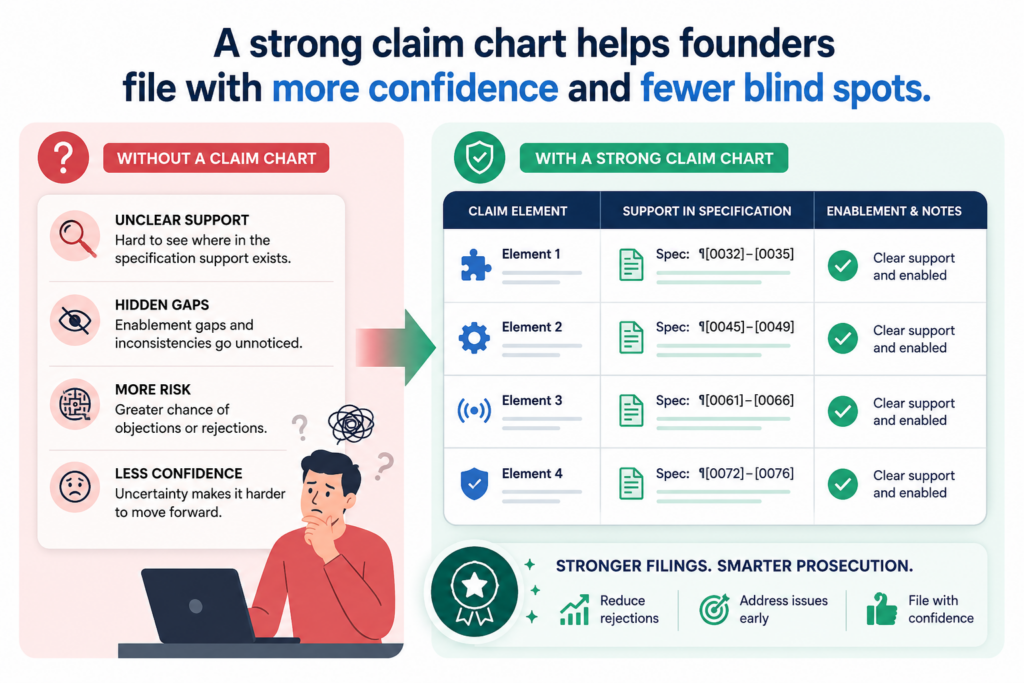
Without a chart, it is easy to rely on hope. You hope the draft has enough detail. You hope the claims are clear.
You hope the patent covers what matters. You hope no one finds a gap later. Hope is not a strategy.
With a chart, the team can see the support. They can see the weak spots. They can see where the claim is too broad, where the draft is too thin, where a term is unclear, and where more technical detail should be added.
This is why claim charts are so useful before filing. They help protect the invention while the team still has room to improve the application.
They also help founders stay involved without getting buried in legal language.
The business value of the chart is speed with better control
For a founder, the point is not to create paperwork. The point is to make better IP decisions faster.
A clear chart helps you decide what to file, what to refine, what to hold for a later filing, and what needs more invention detail. It also helps your attorney ask better questions.
Instead of vague calls about “the invention,” the team can talk about exact claim features and exact support gaps.
That saves time. It also makes the patent feel less like a black box. You can see what is happening. You can review the logic. You can make smart calls without becoming a patent expert.
The USPTO’s Section 112 framework separates different issues, including written description, enablement, and claim definiteness.
A good chart respects those differences. It does not treat support, teaching, and clarity as the same thing. It checks each one on purpose.
The best time to chart is before the application is filed
The best time to build a Section 112 chart is before filing, not after rejection, not during diligence, and not when a competitor appears.
Before filing, the team has more room to improve the draft. You can add examples. You can add figures.
You can explain more versions. You can clean up claim terms. You can tighten the story. You can make sure the patent matches the real invention.
After filing, the room to add new detail is limited. That does not mean all is lost, but it does mean the easy window may be gone.
A startup should not wait until the patent is under pressure to find out whether the support is strong.
This is where PowerPatent can help. The goal is not just to file something. The goal is to file smarter, with a clearer map, stronger support, and real attorney guidance. For founders, that means less guesswork and more confidence.
You can explore the PowerPatent process here: https://powerpatent.com/how-it-works
A claim chart should show the difference between a feature, a result, and a wish
A strong Section 112 chart does more than match words. It separates real invention detail from broad product hope.
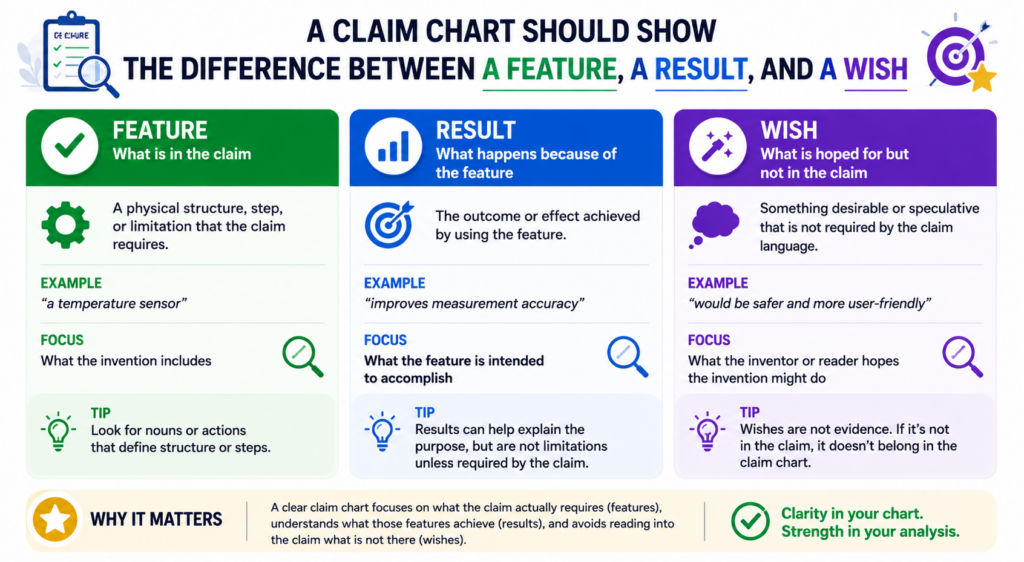
This is important because many patent drafts sound strong at first, but when you read them closely, they only describe what the system is supposed to achieve. They do not explain the parts, steps, data, logic, or structure that make the result happen.
This matters most when a team is moving fast. Founders often say, “Our system detects risk,” “Our engine improves accuracy,” or “Our platform automates review.”
Those phrases may be true, but they are still high-level results. A patent claim needs more than a goal. The chart should show what the system actually does to reach that goal.
Section 112(a) asks for a written description and enough teaching to make and use the invention.
The USPTO treats written description, enablement, and best mode as separate requirements, which means a draft can be weak in one area even if it sounds fine in another.
A result is not enough unless the draft explains how the result is achieved
A claim chart should flag result-only language right away. If a claim says the system “improves model accuracy,” the chart should ask how.
Does the draft explain a new training method, a data filter, a feedback loop, a weighting rule, a special model structure, a new sensor setup, or a better way to process bad data?
That is the heart of the issue. The invention is not the happy ending. The invention is the way the system gets there.
For an AI startup, this can be the difference between a useful patent and a thin one.
If the draft says the model gives better results but does not explain the input data, training process, tuning method, output use, or system feedback, the support may feel soft. A claim chart makes that softness visible.
The chart should turn every broad benefit into a concrete technical step
A good move is to take each broad benefit and trace it backward. If the benefit is faster routing, the chart should show the routing logic.
If the benefit is safer device control, the chart should show the control rules. If the benefit is cleaner data, the chart should show the cleaning method.
This approach keeps the patent grounded. It also helps the founder see what is really valuable about the invention.
Sometimes the product pitch focuses on the outcome, but the patent value sits in a small technical choice that competitors would love to copy.
PowerPatent helps teams pull out those technical choices earlier, so the draft is not just a polished story. It becomes a clearer record of how the invention works, with software support and attorney review built into the process.
You can review the PowerPatent workflow through its official how-it-works page.
A chart should test whether the claims are broader than the examples
Broad claims can be powerful when they are supported. They can protect more than the first version of a product.
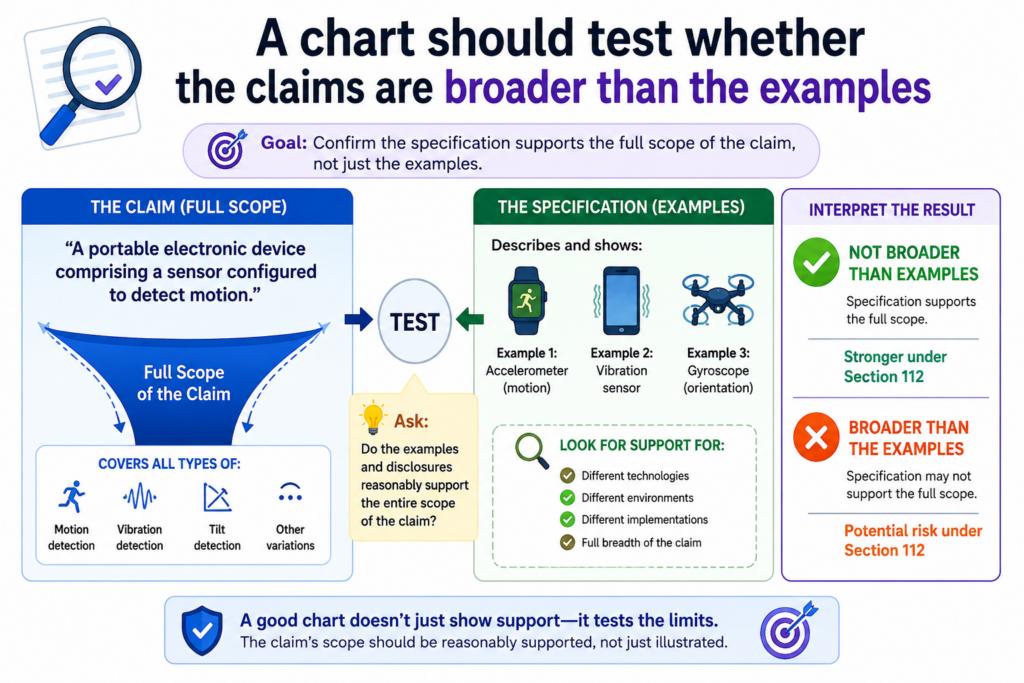
They can cover different setups, user flows, hardware choices, model types, and deployment paths. But broad claims can also create Section 112 risk when the draft only shows one narrow example.
A Section 112 chart should compare the size of the claim against the size of the disclosure. It should ask whether the patent draft gives enough support for the full reach of the claim.
This is not about making every claim small. It is about making sure the patent has enough ground under the claim.
The enablement question is especially important here. The USPTO explains that enablement asks whether a skilled person could make and use the claimed invention without undue experimentation.
It is not about whether any testing is needed. It is about whether the testing needed would be unreasonable.
The chart should mark where one example is being stretched across many versions
A common issue appears when a draft describes one version, but the claim covers many. The draft may explain one sensor, while the claim covers any sensor.
It may describe one machine learning model, while the claim covers any predictive model. It may show one cloud setup, while the claim covers cloud, edge, mobile, embedded, and hybrid systems.
That may be okay in some cases. It depends on the field, the level of detail, the skill in the art, and how much work is needed to use the broader claim. But the chart should not skip the question.
It should show whether the draft gives enough examples, alternatives, and common principles to support the broader wording.
This is where founders can make smart choices. The answer may not be to narrow everything.
The answer may be to add more examples, more system versions, more data cases, more fallback options, or more explanation of why the same core idea works across different setups.
The safest broad claim has a clear common thread running through every version
The chart should look for the common thread. If the patent covers many versions, what is the shared idea? Is it a specific data transform?
A control loop? A device layout? A model update rule? A secure handoff? A ranking method? A signal path?
That common thread should be easy to see in the draft. If it is not easy to see, the claim may look like it is reaching too far. The chart helps the team find that weak spot and fix it while there is still time.
This is very useful during product growth. Your first version may run on a laptop, but the future version may run in the cloud. Your first customer may use one data type, but the next customer may use three.
Your first model may be simple, but the next model may be more advanced. A good claim chart helps your patent cover the path forward without losing the support needed under Section 112.
A chart should catch unclear words before they become expensive words
Unclear claim words are easy to miss because they often sound normal. Product teams use words like smart, fast, secure, automatic, dynamic, trusted, optimized, reliable, and high quality all the time.
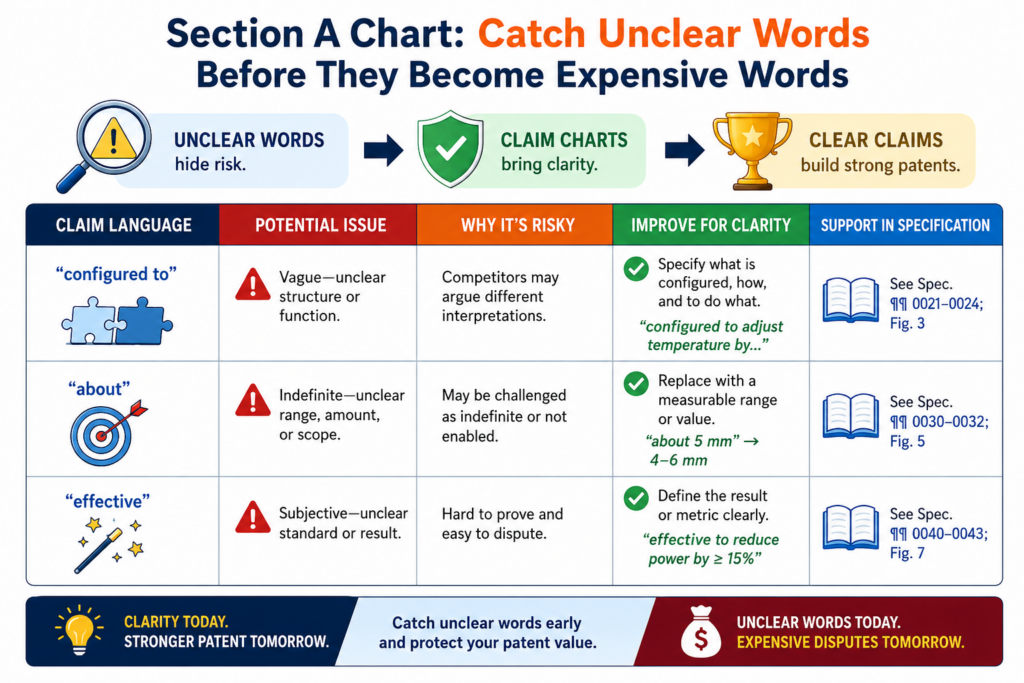
In a pitch deck, those words may be fine. In a patent claim, they need care.
A clarity chart should ask whether each important word has a clear meaning in the patent. It should also ask whether the claim tells people where the boundary is.
Section 112(b) requires claims to particularly point out and distinctly claim what the inventor regards as the invention. The USPTO explains that this is commonly handled as the definiteness requirement.
Clear language does not make a patent weak. In many cases, it makes the patent harder to attack because the reader can better understand what is covered.
The chart should test claim terms against real examples in the draft
One useful way to test clarity is to ask whether the draft gives examples for the claim term. If the claim says “secure session,” the chart should point to how the session is secured.
If the claim says “live data,” the chart should show what counts as live data. If the claim says “adaptive threshold,” the chart should show what changes, when it changes, and what causes the change.
This does not mean every word needs a formal definition. Over-defining can make a patent stiff and narrow. But key claim terms should not feel like fog.
The chart should help the team decide which terms need support, which terms should be replaced, and which terms should be explained through examples.
For founders, this is a practical step. You do not need to become a claim drafting expert. You only need to ask, “Would a smart engineer understand the line this word draws after reading the patent?” If the answer is no, the chart has done its job.
The best fix for unclear wording is often a better technical anchor
When a claim word feels unclear, the answer is not always a definition. Sometimes the better answer is a technical anchor.
For example, instead of relying only on “optimized,” the draft can explain the metric being improved and the steps used to improve it. Instead of relying only on “secure,” the draft can explain the token, key, access rule, encrypted path, or identity check.
Instead of relying only on “near real time,” the draft can explain the event trigger, update cycle, response window, or system behavior.
This approach keeps the writing simple while making the claim stronger. It also makes the patent easier for engineers, examiners, investors, and partners to understand.
PowerPatent is useful here because it helps teams connect claim language to the actual invention record. That can make unclear terms easier to spot, discuss, and improve with attorney input before filing.
PowerPatent’s official page describes tools for drafting claims and generating detailed descriptions from drawings and related invention material.
A chart should make software and AI inventions feel less like a black box
Software and AI patents can be hard to write because the invention often lives behind screens, APIs, models, scripts, pipelines, and data flows.
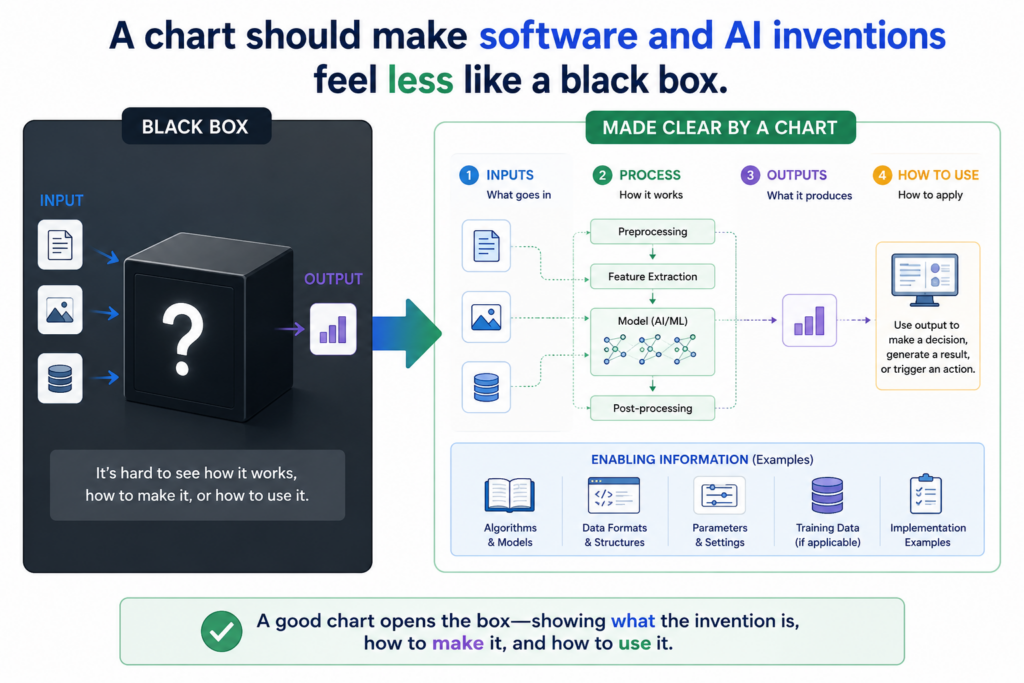
The product may look simple to the user, but the real invention may be hidden inside the system. A Section 112 chart helps bring that hidden work into the patent.
The chart should not treat software as magic. It should show inputs, processing steps, decision points, outputs, storage actions, training flows, model updates, user actions, and system responses.
It should also show how different parts work together. This is what turns a vague software idea into a technical patent story.
The USPTO’s Section 112 guidance notes that computer-implemented inventions can raise written description, enablement, and clarity issues, including issues tied to functional claim language.
That makes support mapping especially useful for software teams.
The chart should show the data path from start to finish
For software and AI claims, the data path is often the best place to start. The chart should ask where the data comes from, how it is received, how it is cleaned, how it is changed, how it is stored, how it is used, and what the system does after producing an output.
This simple path can reveal major gaps. A claim may say the system “generates a recommendation,” but the draft may not say what data is used to make the recommendation.
A claim may say the system “updates a model,” but the draft may not explain what event triggers the update. A claim may say the system “detects abnormal behavior,” but the draft may not describe the baseline, the signal, or the decision rule.
The chart helps the team avoid these weak spots. It also helps the attorney ask better questions because the missing parts are visible.
The strongest software support often comes from flow, not from code
A patent usually does not need to include source code. In many cases, clear flow is more useful.
The patent should explain what happens, in what order, using what information, and for what technical reason.
For AI systems, the chart should also look at the model lifecycle. It should check whether the draft explains training data, feature extraction, labels, model selection, training steps, inference steps, feedback, and updates when those details matter to the claim.
If the claim is about a model output, the chart should also show how the output changes the system or helps the user take action.
This is where engineers can add huge value. They know the hidden logic. They know what makes the system different. They know what shortcuts do not work. A claim chart gives them a simple way to turn that knowledge into patent support.
For a startup, this can be a real moat. Competitors can copy a screen. They can copy a workflow. They may even copy a pitch. A well-supported patent focuses on the deeper system choices that are harder to design around.
A chart should help the team decide what to add before filing
The best Section 112 chart does not just point out problems. It helps the team improve the patent. That is why the chart should be built while the draft is still alive, not after everyone thinks the work is done.
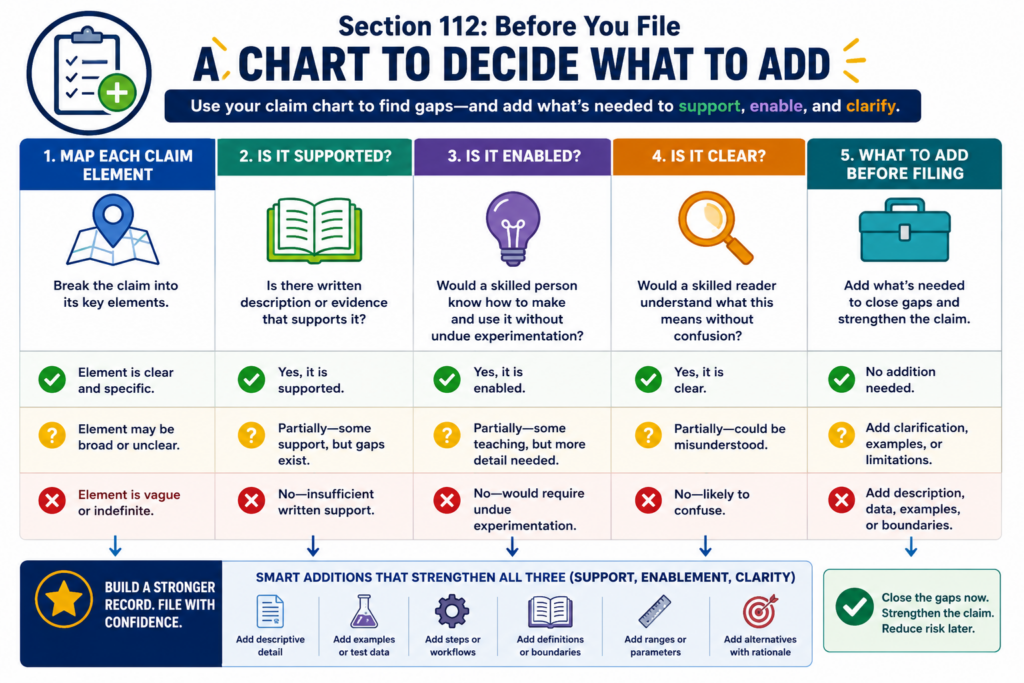
Before filing, the team can still add detail, improve figures, explain examples, tighten claim terms, and capture versions that matter.
After filing, adding new technical detail can be much harder. That makes early charting one of the most practical ways to reduce patent risk.
For founders, this is not about slowing down. It is about avoiding slow pain later. A few careful changes before filing can prevent office action trouble, investor questions, licensing doubt, or claim weakness years later.
The chart should lead to clear drafting moves, not vague comments
A weak chart says, “Needs more support.” A strong chart says what kind of support is missing.
If the issue is written description, the draft may need a clearer statement of the feature, more versions, better drawings, or a stronger tie between the problem and the solution.
If the issue is enablement, the draft may need steps, settings, examples, inputs, outputs, ranges, system behavior, or build details. If the issue is clarity, the claim may need cleaner words, better term support, or a more precise link to the specification.
This makes the review process much faster. The founder does not have to guess what the attorney means. The engineer does not have to sit through a long abstract call. The team can work from a shared map.
The right claim chart turns review into a focused build session
A good chart changes the mood of patent review. Instead of asking, “Is this patent good?” the team asks, “Where is the support for this claim part, and what should we add?”
That is a much better question. It is focused. It is answerable. It leads to action.
This also helps when the team has limited time. Startups rarely have weeks to polish every line. They need a way to find the highest-value fixes quickly. The chart shows which gaps matter most.
A missing example for a key claim may be urgent. A minor wording issue in a backup claim may be less urgent. A broad term that covers the core product may need careful attorney review.
PowerPatent is built for this kind of founder-friendly patent work. The platform helps move from invention input to claims and detailed description, while keeping room for patent skill and review.
Its official how-it-works page describes AI-assisted drafting support for claims and descriptions, along with tools aimed at catching Section 112 issues.
A claim chart should make each claim feel like a clean chain, not a pile of parts
A patent claim should feel like a chain. Each part should connect to the next part. The system receives something, does something with it, produces something, and uses that result in a clear way.
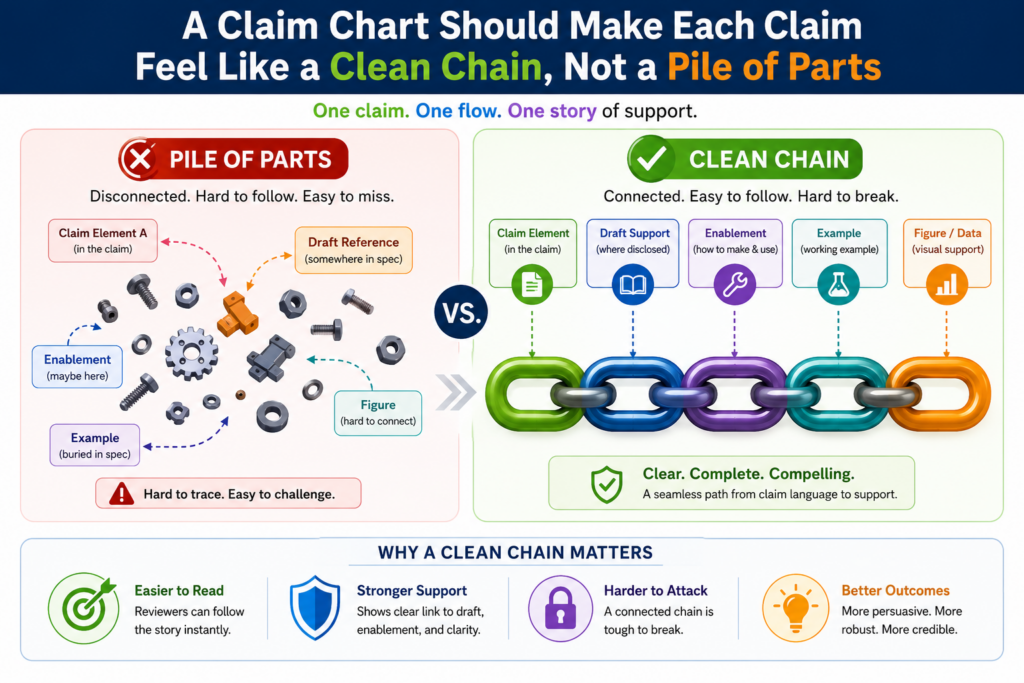
When a claim feels like loose pieces placed side by side, a Section 112 chart can help fix the flow before the draft is filed.
This matters because support is not only about whether each word appears somewhere in the patent. It is also about whether the invention is described as a working whole.
A draft may mention the data, the model, the display, and the output. But if it never explains how those pieces work together, the claim may feel thin.
The USPTO explains that written description and enablement are separate requirements.
A disclosure may describe something, but that does not always mean it teaches how to make and use the full claimed invention without undue experimentation.
A connected chart helps the team see whether the invention works as claimed
A useful claim chart should not treat each claim element like an island. It should show how the parts work together.
If the claim says a device receives data, generates a score, compares the score to a limit, and changes a machine setting, the chart should show the support for each step and the support for the connection between the steps.
That connection is often where the real invention lives. The smart part may not be the sensor. It may not be the score.
It may not even be the machine setting. The smart part may be the way the system uses one result to change the next action.
A founder should ask a simple question during review: after reading the chart, can a person follow the invention from start to finish?
If the answer is yes, the patent story is getting stronger. If the answer is no, the draft may need more flow, more examples, or a better drawing.
The best chart explains what happens before, during, and after the key step
Many patent drafts focus too much on the hero step. That is the exciting part of the invention, so it gets all the attention. But Section 112 support often needs the setup and the result too.
If the key step is model scoring, the draft may also need to explain the input data and the system action after scoring.
If the key step is signal filtering, the draft may need to explain the raw signal and the output signal. If the key step is route selection, the draft may need to explain the route options and the chosen action.
This is where a claim chart becomes a very practical tool. It shows whether the patent has a full chain or only a strong middle.
A strong patent usually needs both. It should explain the invention in a way that feels complete, not mysterious.
For a startup, this can also improve the product story. When the claim chain is clear, the team can explain the invention better to investors, partners, and future buyers.
The patent becomes more than a filing. It becomes a clear record of what makes the technology special.
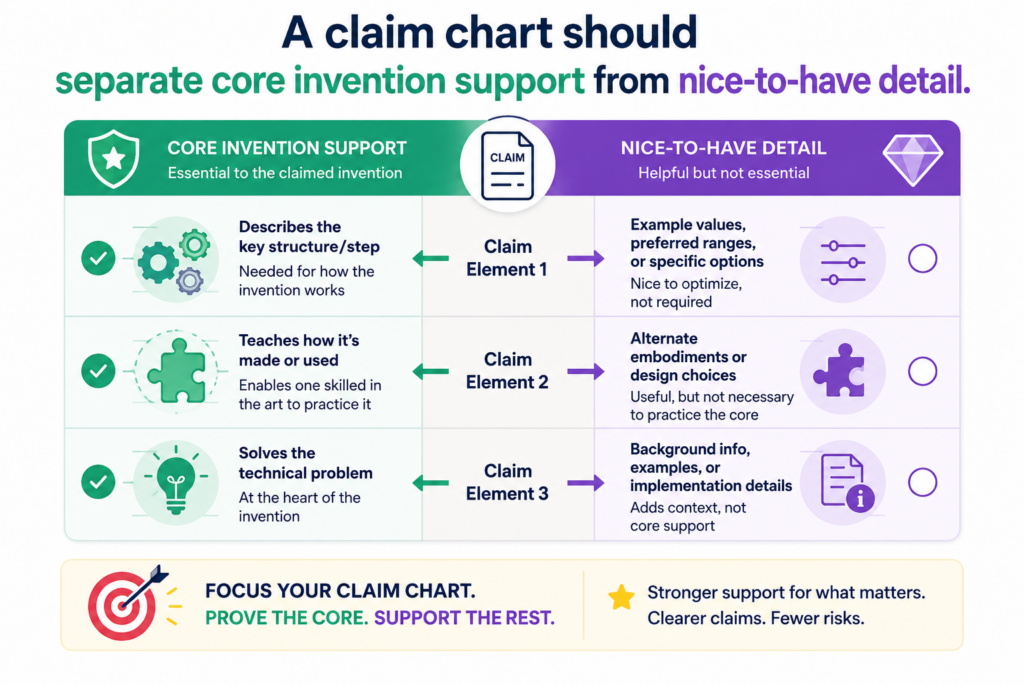
A claim chart should separate core invention support from nice-to-have detail
Not every detail in a patent has the same value. Some details support the heart of the invention.
Other details help explain one version, one example, or one product setting. A strong Section 112 chart helps the team tell the difference.
This is important because founders often have limited time. They cannot polish every line forever. They need to know which gaps matter most.
A missing detail tied to the main independent claim may be urgent. A missing detail tied to a backup version may still matter, but it may not carry the same business risk.
The chart should help the team focus attention where it counts. It should show which claim parts protect the core product, which parts protect future versions, and which parts may only support a narrow use case.
The core claim elements deserve the deepest support
A core claim element is a part of the claim that the invention cannot live without.
It may be the new data transform, the model update process, the sensor arrangement, the control rule, the secure handoff, the special user workflow, or the way two systems interact.
The chart should spend more time on these parts. It should point to strong written support, clear teaching, and clean wording. If the core element is weak, the whole claim may feel weak.
For example, if the invention is a way to reduce false alerts in a medical device, the chart should not only say the draft mentions false alerts.
It should show the actual signal path, the decision rule, the alert logic, and the action taken when the alert is suppressed or shown.
If the invention is a way to route battery power in a robotics system, the chart should explain the conditions, the control step, and the system response.
The chart should not let small details distract from the main patent value
Patent drafts can become crowded. They may include many parts, screens, options, settings, and examples. Detail is good, but only when it helps the reader understand and support the claims.
A claim chart helps the team avoid spending all its energy on side issues. If a side feature is not claimed, it may not need the same level of review.
If a side feature might become important later, the team can decide whether to add a dependent claim or save it for another filing.
This is one reason PowerPatent is useful for startup teams. Founders need a process that helps them move quickly without losing sight of what matters.
Smart software can help organize the invention, while real attorney oversight can help decide which claim features deserve the most care. See how it works here: https://powerpatent.com/how-it-works
When a chart is used well, it becomes a priority tool. It does not just say whether the draft has support. It helps the team decide where to spend time, what to strengthen, and what to leave alone.
A claim chart should test whether dependent claims have real backup value
Dependent claims are not filler. They can be very useful when they are written with care. They can protect fallback versions, commercial features, narrow technical improvements, and specific ways the invention may be used.
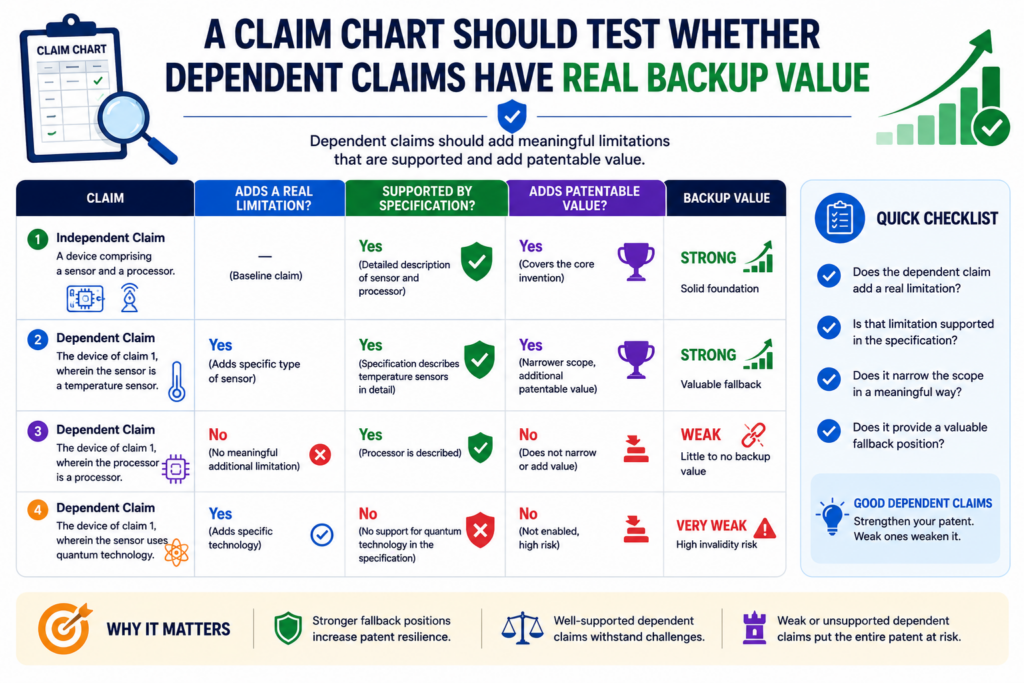
A Section 112 chart should test dependent claims just as carefully as independent claims, but with a slightly different mindset. The goal is to make sure each dependent claim adds something real.
If a dependent claim only repeats the main idea with softer words, it may not help much. If it adds a concrete technical choice that is well supported, it can become valuable backup.
This matters because patent examination can change the shape of the claims. A broad claim may need to be adjusted.
A strong dependent claim can give the team room to move without losing the invention’s business value.
A dependent claim should point to a useful version, not a random detail
A good dependent claim usually protects a meaningful version of the invention. It may cover a special data source, a tighter model step, a safety rule, a hardware layout, a calibration process, a user control, or a fallback path.
The claim chart should ask why the dependent claim matters. Does it protect a version customers will use? Does it cover a version competitors may copy?
Does it protect a product roadmap item? Does it make the invention clearer? Does it create a stronger backup if the broad claim is challenged?
This review is simple, but many teams skip it. They focus on the main claim and treat dependent claims as extra decoration. That is a mistake. Dependent claims can carry real value when they are tied to the product and supported in the draft.
The chart should show where each dependent claim gets its added detail
The most important word in a dependent claim is often the new detail it adds. The chart should map that added detail to the specification with care.
If the dependent claim adds a “confidence score,” the chart should show where the draft explains the score, how it is made, and how it is used.
If it adds “edge processing,” the chart should show where the draft explains what happens on the device rather than in the cloud.
If it adds “user approval,” the chart should show where the workflow includes that approval and what happens after approval.
This is also helpful for clarity. A dependent claim can make the patent stronger only if the added limit is clear. If the added term is vague, unsupported, or hard to understand, the backup may not be as useful as it looks.
A strong chart turns dependent claims into a smart safety net. It helps the team avoid random narrowing and focus on versions that matter to the business.
A claim chart should help avoid accidental new matter problems later
One of the biggest reasons to build a Section 112 chart early is simple: it is easier to add support before filing than after filing.
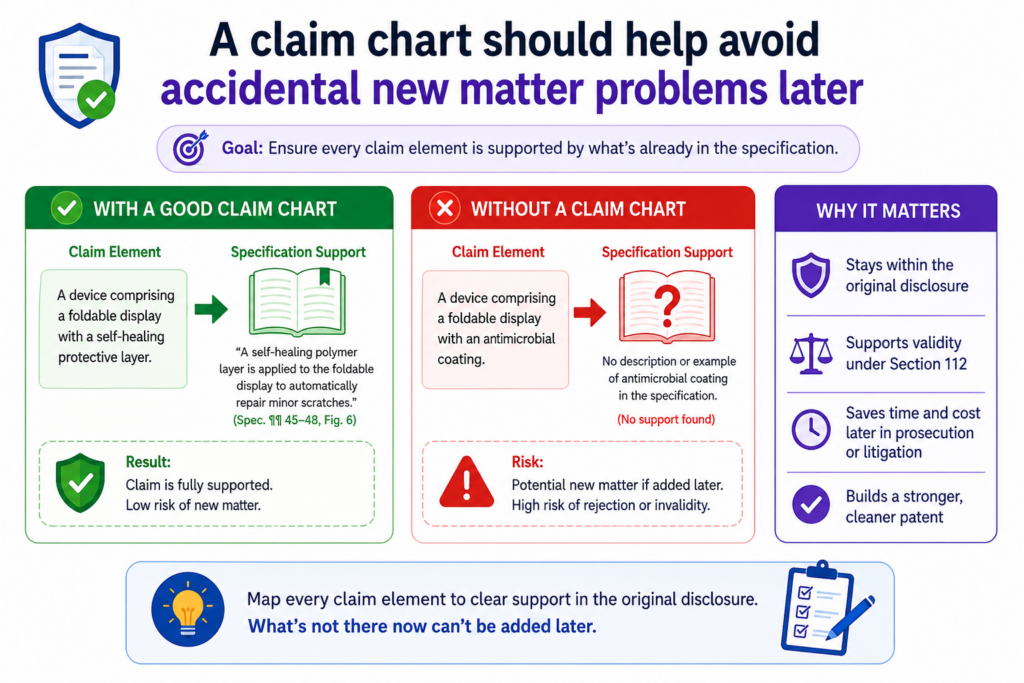
Once a patent application is filed, the team may not be able to add new technical details freely.
If the missing detail was not in the original application, adding it later may create a new matter issue. That can limit what the team can fix after the fact.
This is why early support mapping is so valuable. The chart helps find missing detail while the team can still improve the application. For startups, that can save time, money, and stress.
The chart should catch missing support before the filing date locks the story
A filing date is powerful because it marks the date tied to the patent application. But it also locks in the story that was filed.
If the draft is thin on a key point, the team may not be able to repair it later by adding brand-new technical explanation.
The USPTO’s written description guidance focuses on whether the original application shows possession of the claimed invention. That is why support in the filed specification matters so much.
A claim chart helps by showing which claim features are not yet grounded in the draft. If the chart cannot find support for a feature, that is the moment to act.
The team can add a figure, explain a workflow, describe an example, include alternatives, or adjust the claim before filing.
The safest filing is one where the chart has already forced the hard questions
A good chart makes the team face hard questions early. What does this claim term mean? Where do we show this feature?
Did we explain how it works? Are we covering more than we taught? Are we relying on product knowledge that is not in the draft?
These questions may feel slow at first, but they often save time. They reduce the chance of a rushed filing that later needs painful cleanup.
For technical founders, this is especially important because the invention may be obvious to the team but invisible to the reader.
The chart helps move the missing knowledge from the team’s head into the patent draft.
PowerPatent is built to support this kind of early review. The goal is not just to file quickly.
The goal is to file with more confidence, better support, and less chance of hidden gaps. Explore how PowerPatent works here: https://powerpatent.com/how-it-works
A claim chart should make attorney review faster and more useful
A patent attorney can add the most value when the invention record is clear. A messy record forces the attorney to guess, ask broad questions, or spend time sorting through scattered material. A Section 112 claim chart makes the review sharper.
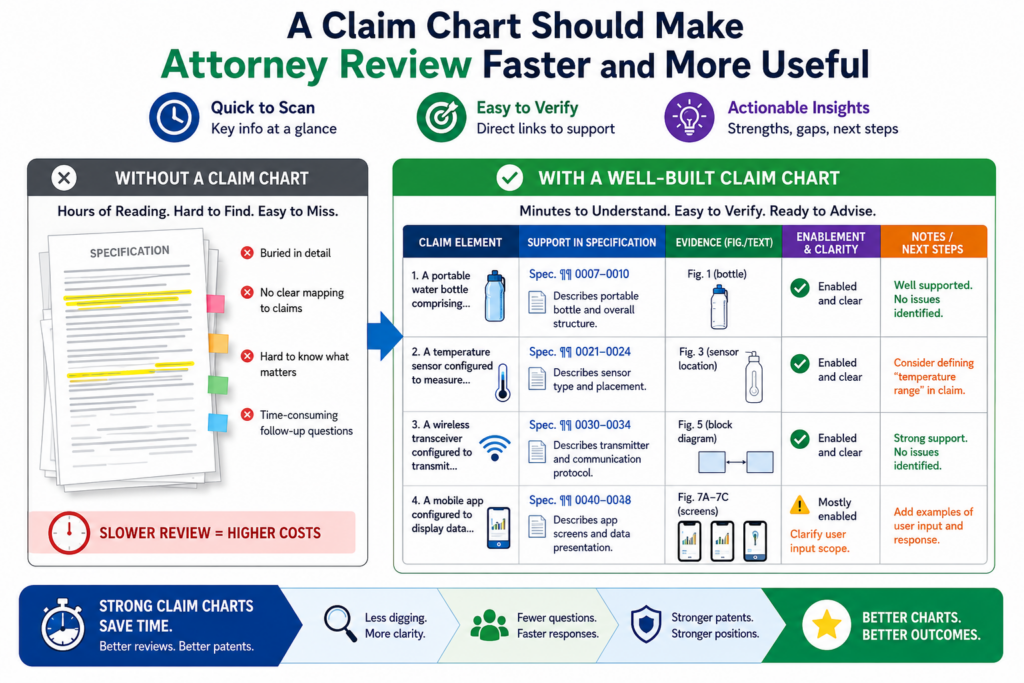
The chart shows what the claims say, where the support is, where the gaps are, and what decisions need attention.
That means attorney time can be spent on judgment, claim strategy, and risk reduction instead of basic detective work.
This is good for founders because it keeps the process moving. It also makes the review feel less like a black box.
You can see why the attorney is asking a question. You can see which claim feature is at issue. You can respond with the right technical detail.
A good chart turns attorney questions into focused engineering answers
Without a chart, an attorney may ask, “Can you explain how the model works?” That question is too broad. The engineer may give a long answer that helps in some ways but misses the claim issue.
With a chart, the question becomes sharper. The attorney can ask, “Where does the system update the model after receiving user feedback?” or “What input causes the threshold to change?” or “Does this version work on the device, in the cloud, or both?”
These focused questions get better answers. They also respect the founder’s time. Startup teams do not have endless hours for patent review. They need a process that gets to the point.
The chart should become a shared workspace between founders, engineers, and counsel
The best patent work happens when the technical team and the legal team are not working in separate worlds. The claim chart brings them into one shared view.
The engineer can confirm whether the support is accurate. The founder can confirm whether the claim protects the business goal.
The attorney can confirm whether the draft and claims are moving in the right direction under Section 112.
This shared view is powerful because patents are both technical and business tools. A claim that is legally polished but misses the product can be weak for the company.
A claim that matches the product but lacks support can be risky. A claim chart helps balance both sides.
That is the kind of workflow PowerPatent was built for. It helps founders move from raw invention material to clearer patent work, backed by smart tools and real attorney oversight.
The result is a process that feels more controlled, more direct, and more useful for busy technical teams.
A claim chart should show where the patent teaches the full claim, not just the easy part
A Section 112 chart should not stop once it finds support for the most obvious feature. It should follow the full claim from beginning to end.
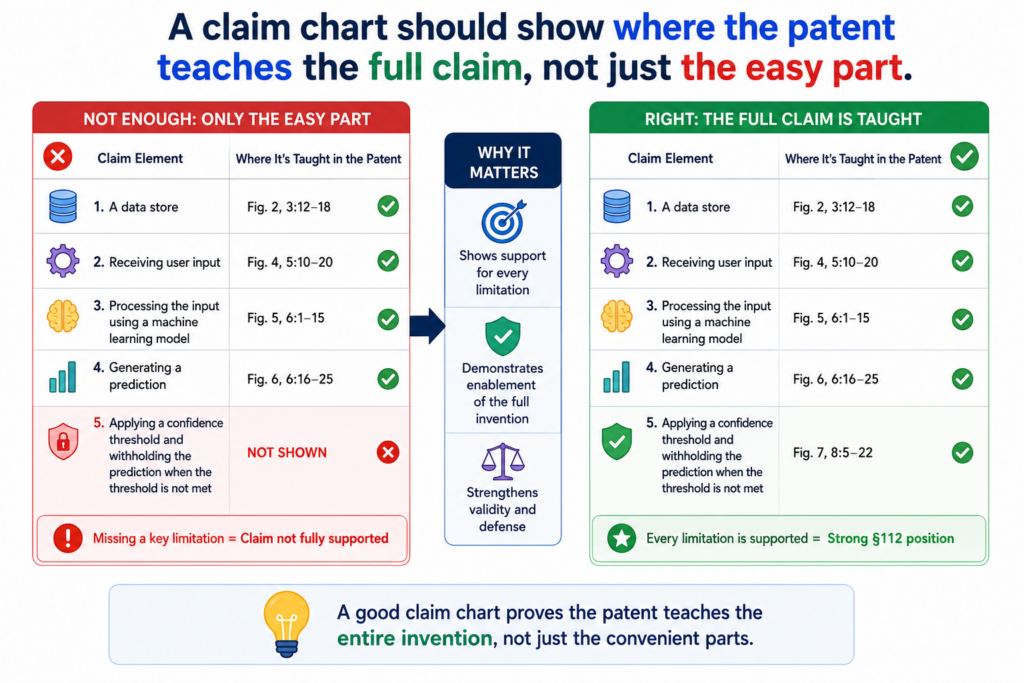
This matters because many weak claims have one well-supported part and several thin parts around it.
For example, a patent draft may explain the machine learning model very well, but barely explain the data source, the output format, the user action, or the system change that happens after the model runs.
That can create a support problem because the claim is not only about the model. It is about the whole claimed process or system.
The enablement requirement asks whether the patent teaches a skilled person how to make and use the full scope of the claimed invention without too much extra work.
The USPTO also makes clear that enablement is separate from written description, so a draft must do more than show that the inventor had the idea. It must also teach enough for use.
The full claim must be charted as one working path
A strong chart should read like a working path through the invention. It should show what enters the system, what the system does, what comes out, and why that output matters.
This sounds simple, but it is often where the draft breaks. Many teams describe the best part of the invention in detail and assume the rest is clear.
Engineers do this because the missing pieces feel normal to them. They know how the system works, so they do not always notice what has been left out.
The chart should catch that. It should ask whether the patent explains the start, middle, and end of the claim. If one part is missing, the chart should not hide it behind strong support for another part.
The weakest part of the claim can become the easiest attack point
A claim is only as strong as its weak points. If one feature is unclear, unsupported, or not enabled, that feature can become the place where trouble starts.
That is why the chart should not give a claim a pass just because the invention sounds good. It should check every claimed step and every claimed structure.
If the claim says that the system “stores a ranked output in a user profile,” the chart should show where the draft explains the storage, the ranking, the user profile, and the reason the ranked output is placed there.
This is very practical for founders. You do not need to know every patent rule to spot risk.
You only need to look at each claim part and ask, “Where did we explain this in the draft?” If the answer is weak, the draft needs more work.
PowerPatent helps make this kind of review easier by helping teams move from invention material to a more complete first draft, while also supporting claim review and Section 112 issue spotting. See how PowerPatent works here: https://powerpatent.com/how-it-works
A claim chart should expose hidden assumptions before they become filing mistakes
Every technical team has hidden assumptions. The team knows what a “node” means. The team knows which model is used.
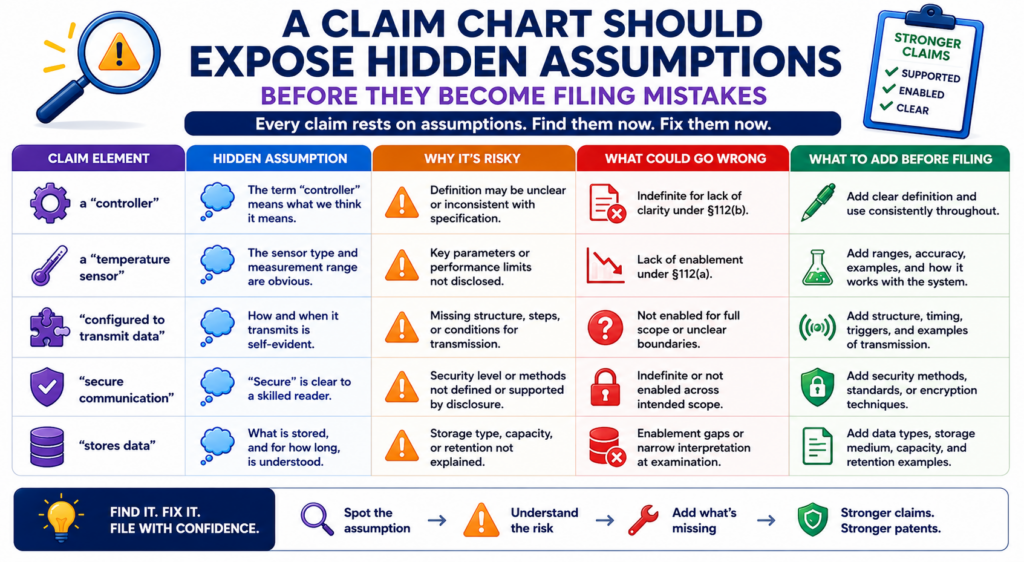
The team knows when data is fresh enough. The team knows why one threshold works better than another. But the patent reader may not know any of that.
A Section 112 chart is useful because it turns assumptions into questions. It asks whether the draft actually says what the team thinks it says.
It also asks whether a skilled reader could understand and use the invention without needing private knowledge from the inventors.
This is especially important for startups because product speed creates shorthand. Internal words become normal.
Team slang becomes part of the draft. A chart slows that down just enough to make sure the patent is clear.
The chart should ask what the team knows that the draft does not say
A common support gap appears when an engineer says, “That part is obvious.” Sometimes it is. Sometimes it is not. The chart helps sort that out.
If the claim says “validating a device,” the chart should ask what validation means. Is the device checked against an identity token? Is it checked against a certificate?
Is it checked using a past behavior pattern? Is it checked using a hardware key? If the draft does not say, the claim may be too vague or too thin.
The same issue comes up with words like “trained,” “filtered,” “matched,” “ranked,” “safe,” “approved,” and “verified.” These words can be fine, but the chart should force the team to explain the technical meaning.
A hidden assumption can be fixed with one clear paragraph or one better figure
The good news is that many hidden assumptions are easy to fix before filing. The team may only need to add a clear paragraph, a simple example, a figure label, a flow step, or a short description of how the feature works.
This is one of the biggest benefits of a claim chart. It does not only find problems. It shows where a small fix can make the patent much stronger.
For example, if a claim uses “live sensor data,” the draft can explain whether live means received during operation, received within a certain time window, received before a control action, or received in response to an event.
That added support can make the term easier to understand.
A founder should not think of this as legal cleanup. It is invention capture. It is the act of getting the real technical work into the patent before the chance is gone.
A claim chart should help define terms without making the claims too narrow
Clear terms help patents. But there is a balance. If a draft defines every term too tightly, the patent may become easier to design around.
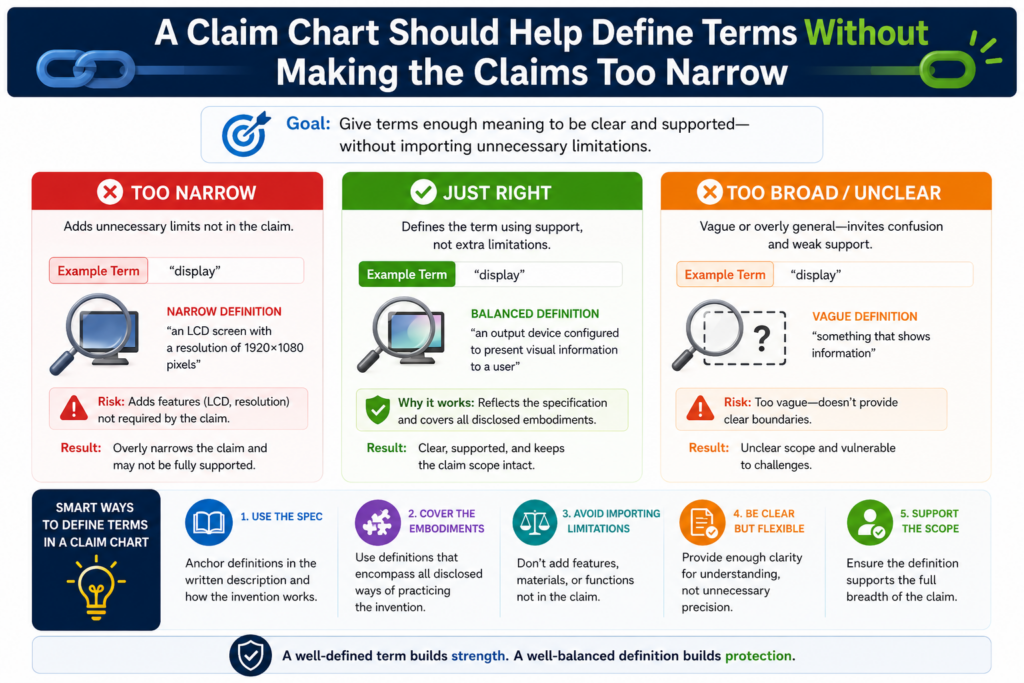
If the draft leaves every term open, the claim may become unclear. A Section 112 chart helps find the middle.
The goal is not to turn the patent into a dictionary. The goal is to make sure important terms have enough meaning in the specification, drawings, and examples.
A person reading the patent should be able to understand the claim boundaries without guessing.
Section 112(b) requires the claims to particularly point out and distinctly claim the invention. The USPTO explains that claim language must be definite to meet this requirement.
The chart should decide which terms need support and which terms can stay flexible
Not every word needs the same level of attention. A common word that is used in a normal way may not need much explanation. A key technical term that drives the invention often needs more.
For example, if the claim turns on a “risk score,” the chart should check whether the draft explains what the score represents, how it is made, what inputs affect it, and what the system does with it.
If the claim turns on a “trusted device,” the chart should check what makes a device trusted.
This does not mean the draft must define those terms in a rigid way. It may be better to explain them through examples and system behavior. That gives the reader meaning without locking the invention into only one version.
The best term support often comes from showing use, not from writing a hard definition
A formal definition can help, but it can also create limits. Many times, the stronger move is to show how the term works inside the system.
If the claim uses “confidence value,” the draft can show how the value is generated, compared, stored, and used to trigger an action.
If the claim uses “adaptive rule,” the draft can show what causes the rule to change and how the changed rule affects the system.
This kind of support is easier for engineers to provide because it matches how they think. They may not want to write a legal definition, but they can explain what the system does.
For a startup, this is a smart way to keep the patent both clear and useful. The claim terms get enough meaning to reduce confusion, but the draft still leaves room for future versions.
A claim chart should test whether the drawings carry enough support
Drawings can do a lot of work in a patent. They can show system parts, data flow, device layouts, user screens, process steps, timing, and relationships between components. But drawings only help if they are clear and tied to the written description.
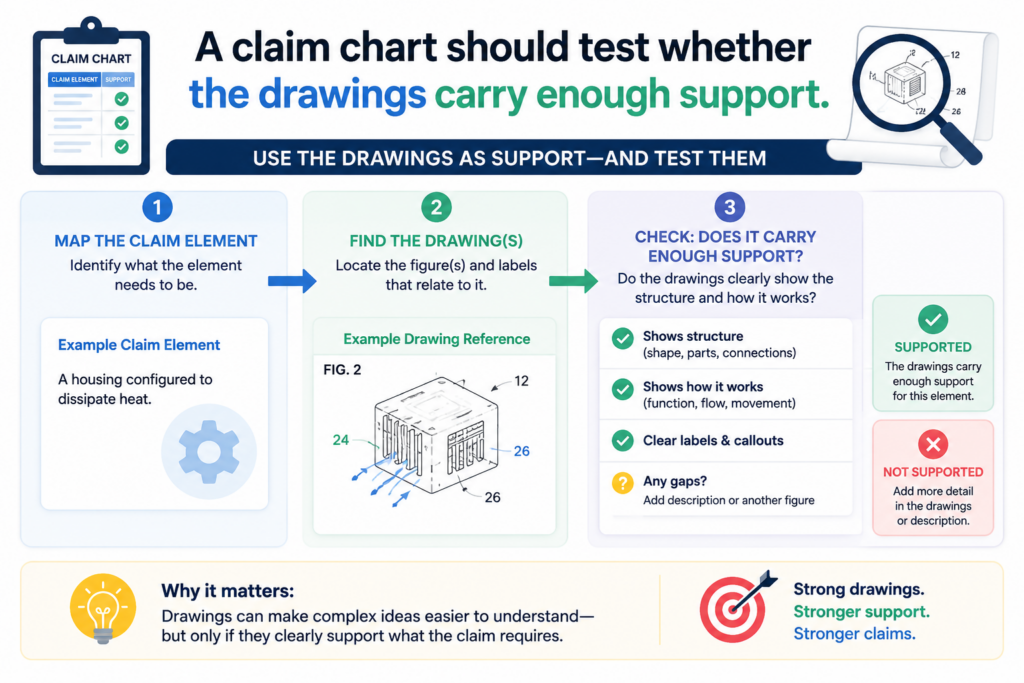
A Section 112 chart should not treat drawings as decoration. It should ask whether the drawings support the claim and whether the text explains the drawings well enough.
A figure with boxes and arrows can be helpful, but if the boxes are not described, the support may still feel thin.
This is a common issue in software and hardware patents. The team includes a system diagram, but the draft does not explain what each module does.
Or the team includes a flowchart, but the text skips the hard step. The chart should bring that out.
The chart should connect claim language to both figure numbers and written text
A good chart can point to a figure, but it should usually point to the matching text too. A figure may show a “processing module,” but the written description should explain what that module receives, what it does, and what it produces.
This is important because drawings can be read in different ways. Text helps lock in the meaning.
If the claim says a controller changes a machine setting, the chart should not only point to a controller box in a figure. It should point to the paragraph that explains the change.
When drawings and text work together, the patent becomes easier to understand. The examiner can follow it. The attorney can defend it. The founder can explain it. The engineer can confirm it.
Strong drawings often make Section 112 review faster because they reveal missing links
A good figure makes gaps easy to see. If the claim has five steps and the drawing only shows three, the team can ask why.
If the claim says data moves from one system to another, but the drawing never shows that connection, the team can add it before filing.
Drawings are also helpful for future versions. A system diagram can show cloud, edge, device, and user layers.
A flowchart can show optional paths. A timing diagram can show event order. A user interface figure can show how the system presents a result.
PowerPatent’s workflow is built around turning invention input, claims, and figure material into richer patent drafts, which can help teams create a more complete description around the drawings. Learn more here: https://powerpatent.com/how-it-works
For founders, the key lesson is simple. Do not let figures sit alone. Make them earn their place. Every important figure should help support a claim, explain a hard part, or show a useful version of the invention.
Conclusion
Claim charts for Section 112 are not extra paperwork. They are the clean map that shows whether your claims have real support, teach the invention well, and use words people can understand. For founders, that means fewer surprises, stronger filings, and more control over the patent process.
The best time to build this map is before filing, while the team can still add examples, improve drawings, and fix unclear terms. PowerPatent helps turn technical work into clearer patent protection with smart software and real attorney review. See how it works here: https://powerpatent.com/how-it-works